Thai vs Crow Ambulatory Disability
COMPARE
Thai
Crow
Ambulatory Disability
Ambulatory Disability Comparison
Thais
Crow
4.9%
AMBULATORY DISABILITY
100.0/ 100
METRIC RATING
3rd/ 347
METRIC RANK
6.9%
AMBULATORY DISABILITY
0.0/ 100
METRIC RATING
295th/ 347
METRIC RANK
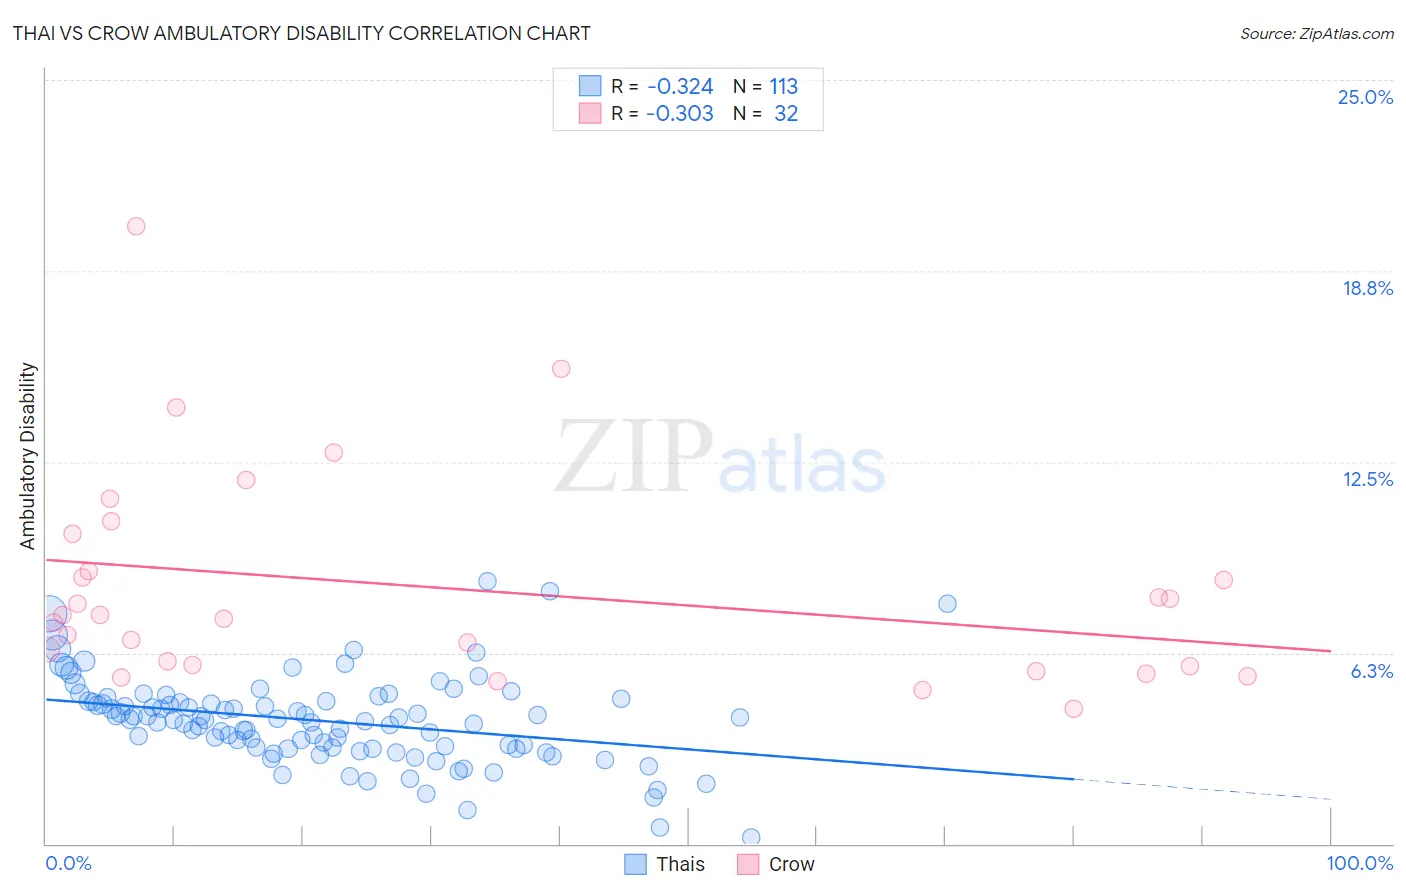
Thai vs Crow Ambulatory Disability Correlation Chart
The statistical analysis conducted on geographies consisting of 475,631,146 people shows a mild negative correlation between the proportion of Thais and percentage of population with ambulatory disability in the United States with a correlation coefficient (R) of -0.324 and weighted average of 4.9%. Similarly, the statistical analysis conducted on geographies consisting of 59,204,118 people shows a mild negative correlation between the proportion of Crow and percentage of population with ambulatory disability in the United States with a correlation coefficient (R) of -0.303 and weighted average of 6.9%, a difference of 40.3%.
Ambulatory Disability Correlation Summary
| Measurement | Thai | Crow |
| Minimum | 0.18% | 4.4% |
| Maximum | 8.6% | 20.2% |
| Range | 8.4% | 15.8% |
| Mean | 4.0% | 8.4% |
| Median | 4.1% | 7.4% |
| Interquartile 25% (IQ1) | 3.1% | 5.8% |
| Interquartile 75% (IQ3) | 4.7% | 9.5% |
| Interquartile Range (IQR) | 1.5% | 3.7% |
| Standard Deviation (Sample) | 1.4% | 3.5% |
| Standard Deviation (Population) | 1.4% | 3.4% |
Similar Demographics by Ambulatory Disability
Demographics Similar to Thais by Ambulatory Disability
In terms of ambulatory disability, the demographic groups most similar to Thais are Immigrants from Taiwan (4.9%, a difference of 0.24%), Filipino (4.9%, a difference of 1.2%), Immigrants from Singapore (5.0%, a difference of 1.6%), Immigrants from Bolivia (5.0%, a difference of 2.3%), and Bolivian (5.1%, a difference of 2.7%).
| Demographics | Rating | Rank | Ambulatory Disability |
| Immigrants | India | 100.0 /100 | #1 | Exceptional 4.8% |
| Filipinos | 100.0 /100 | #2 | Exceptional 4.9% |
| Thais | 100.0 /100 | #3 | Exceptional 4.9% |
| Immigrants | Taiwan | 100.0 /100 | #4 | Exceptional 4.9% |
| Immigrants | Singapore | 100.0 /100 | #5 | Exceptional 5.0% |
| Immigrants | Bolivia | 100.0 /100 | #6 | Exceptional 5.0% |
| Bolivians | 100.0 /100 | #7 | Exceptional 5.1% |
| Immigrants | South Central Asia | 100.0 /100 | #8 | Exceptional 5.1% |
| Iranians | 100.0 /100 | #9 | Exceptional 5.1% |
| Yup'ik | 100.0 /100 | #10 | Exceptional 5.2% |
| Immigrants | Korea | 100.0 /100 | #11 | Exceptional 5.2% |
| Okinawans | 100.0 /100 | #12 | Exceptional 5.3% |
| Burmese | 100.0 /100 | #13 | Exceptional 5.3% |
| Immigrants | Eastern Asia | 100.0 /100 | #14 | Exceptional 5.3% |
| Immigrants | China | 100.0 /100 | #15 | Exceptional 5.3% |
Demographics Similar to Crow by Ambulatory Disability
In terms of ambulatory disability, the demographic groups most similar to Crow are Cape Verdean (6.9%, a difference of 0.070%), Alaskan Athabascan (6.9%, a difference of 0.23%), Immigrants from St. Vincent and the Grenadines (6.9%, a difference of 0.26%), French American Indian (6.9%, a difference of 0.40%), and Immigrants from Grenada (6.9%, a difference of 0.41%).
| Demographics | Rating | Rank | Ambulatory Disability |
| Immigrants | Nonimmigrants | 0.0 /100 | #288 | Tragic 6.9% |
| Immigrants | Dominica | 0.0 /100 | #289 | Tragic 6.9% |
| Scotch-Irish | 0.0 /100 | #290 | Tragic 6.9% |
| West Indians | 0.0 /100 | #291 | Tragic 6.9% |
| Cheyenne | 0.0 /100 | #292 | Tragic 6.9% |
| Immigrants | St. Vincent and the Grenadines | 0.0 /100 | #293 | Tragic 6.9% |
| Cape Verdeans | 0.0 /100 | #294 | Tragic 6.9% |
| Crow | 0.0 /100 | #295 | Tragic 6.9% |
| Alaskan Athabascans | 0.0 /100 | #296 | Tragic 6.9% |
| French American Indians | 0.0 /100 | #297 | Tragic 6.9% |
| Immigrants | Grenada | 0.0 /100 | #298 | Tragic 6.9% |
| Puget Sound Salish | 0.0 /100 | #299 | Tragic 6.9% |
| Marshallese | 0.0 /100 | #300 | Tragic 6.9% |
| British West Indians | 0.0 /100 | #301 | Tragic 7.0% |
| Immigrants | Armenia | 0.0 /100 | #302 | Tragic 7.0% |