Immigrants from Denmark vs Immigrants from Uruguay Ambulatory Disability
COMPARE
Immigrants from Denmark
Immigrants from Uruguay
Ambulatory Disability
Ambulatory Disability Comparison
Immigrants from Denmark
Immigrants from Uruguay
5.8%
AMBULATORY DISABILITY
98.6/ 100
METRIC RATING
93rd/ 347
METRIC RANK
5.9%
AMBULATORY DISABILITY
95.6/ 100
METRIC RATING
113th/ 347
METRIC RANK
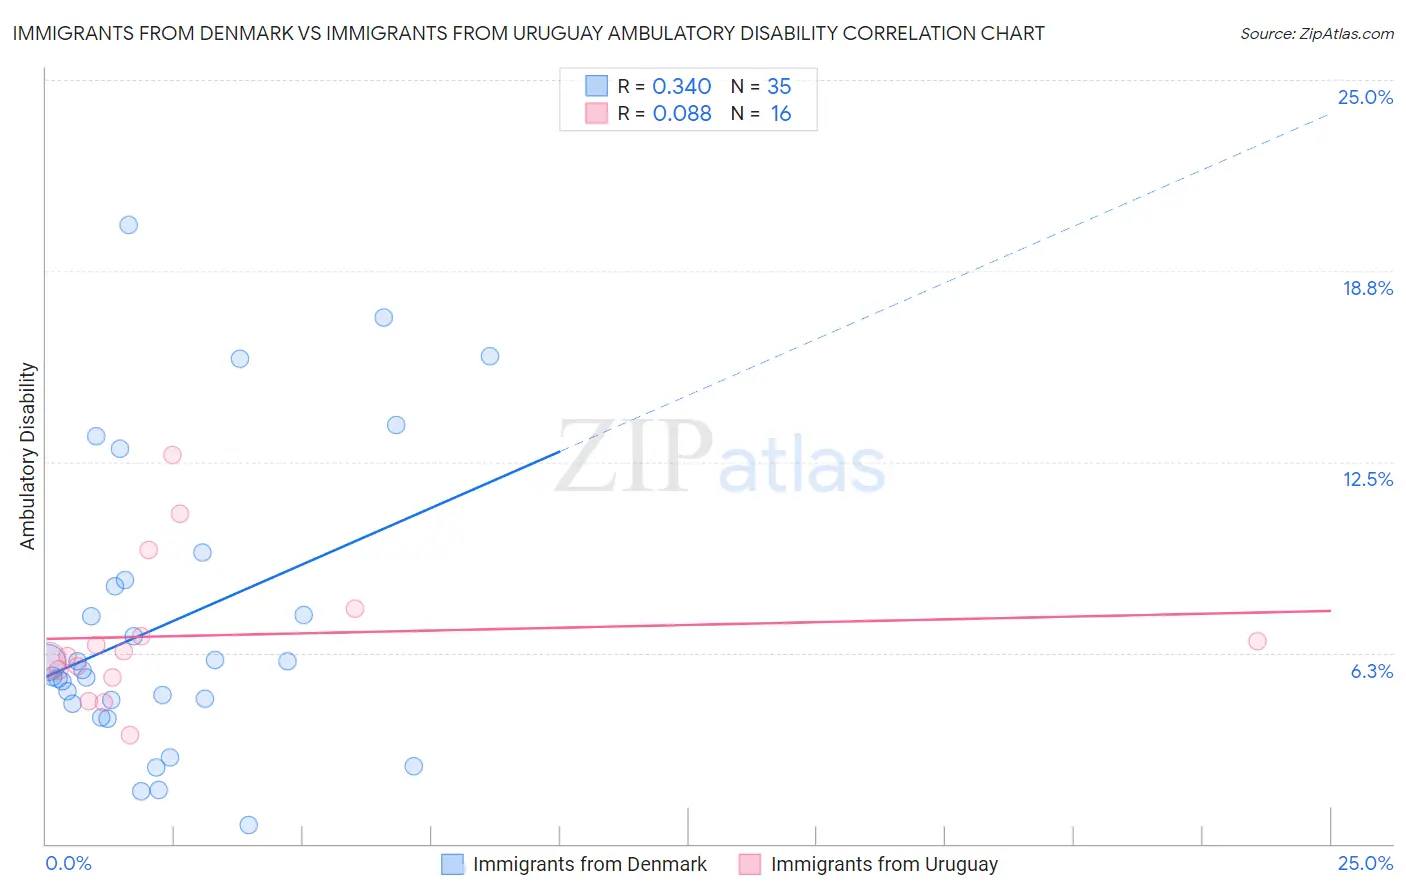
Immigrants from Denmark vs Immigrants from Uruguay Ambulatory Disability Correlation Chart
The statistical analysis conducted on geographies consisting of 136,424,948 people shows a mild positive correlation between the proportion of Immigrants from Denmark and percentage of population with ambulatory disability in the United States with a correlation coefficient (R) of 0.340 and weighted average of 5.8%. Similarly, the statistical analysis conducted on geographies consisting of 133,255,356 people shows a slight positive correlation between the proportion of Immigrants from Uruguay and percentage of population with ambulatory disability in the United States with a correlation coefficient (R) of 0.088 and weighted average of 5.9%, a difference of 1.7%.
Ambulatory Disability Correlation Summary
| Measurement | Immigrants from Denmark | Immigrants from Uruguay |
| Minimum | 0.61% | 3.6% |
| Maximum | 20.3% | 12.7% |
| Range | 19.6% | 9.2% |
| Mean | 7.2% | 6.8% |
| Median | 5.7% | 6.2% |
| Interquartile 25% (IQ1) | 4.6% | 5.6% |
| Interquartile 75% (IQ3) | 8.7% | 7.2% |
| Interquartile Range (IQR) | 4.1% | 1.7% |
| Standard Deviation (Sample) | 4.8% | 2.4% |
| Standard Deviation (Population) | 4.7% | 2.3% |
Demographics Similar to Immigrants from Denmark and Immigrants from Uruguay by Ambulatory Disability
In terms of ambulatory disability, the demographic groups most similar to Immigrants from Denmark are Kenyan (5.8%, a difference of 0.19%), Immigrants from El Salvador (5.8%, a difference of 0.23%), Salvadoran (5.8%, a difference of 0.25%), Immigrants from Somalia (5.8%, a difference of 0.29%), and Immigrants from Lebanon (5.8%, a difference of 0.31%). Similarly, the demographic groups most similar to Immigrants from Uruguay are South African (5.9%, a difference of 0.22%), Danish (5.8%, a difference of 0.35%), Immigrants from Colombia (5.8%, a difference of 0.43%), Immigrants from Netherlands (5.8%, a difference of 0.60%), and Colombian (5.8%, a difference of 0.62%).
| Demographics | Rating | Rank | Ambulatory Disability |
| Immigrants | Denmark | 98.6 /100 | #93 | Exceptional 5.8% |
| Kenyans | 98.4 /100 | #94 | Exceptional 5.8% |
| Immigrants | El Salvador | 98.4 /100 | #95 | Exceptional 5.8% |
| Salvadorans | 98.4 /100 | #96 | Exceptional 5.8% |
| Immigrants | Somalia | 98.3 /100 | #97 | Exceptional 5.8% |
| Immigrants | Lebanon | 98.3 /100 | #98 | Exceptional 5.8% |
| Immigrants | Northern Europe | 98.2 /100 | #99 | Exceptional 5.8% |
| Immigrants | Serbia | 97.9 /100 | #100 | Exceptional 5.8% |
| Immigrants | South America | 97.9 /100 | #101 | Exceptional 5.8% |
| Immigrants | Kenya | 97.8 /100 | #102 | Exceptional 5.8% |
| Immigrants | Romania | 97.7 /100 | #103 | Exceptional 5.8% |
| New Zealanders | 97.6 /100 | #104 | Exceptional 5.8% |
| Immigrants | Czechoslovakia | 97.4 /100 | #105 | Exceptional 5.8% |
| Immigrants | Morocco | 97.3 /100 | #106 | Exceptional 5.8% |
| Uruguayans | 97.2 /100 | #107 | Exceptional 5.8% |
| Colombians | 97.2 /100 | #108 | Exceptional 5.8% |
| Immigrants | Netherlands | 97.1 /100 | #109 | Exceptional 5.8% |
| Immigrants | Colombia | 96.7 /100 | #110 | Exceptional 5.8% |
| Danes | 96.6 /100 | #111 | Exceptional 5.8% |
| South Africans | 96.3 /100 | #112 | Exceptional 5.9% |
| Immigrants | Uruguay | 95.6 /100 | #113 | Exceptional 5.9% |