Thai vs Immigrants from Uruguay Female Poverty
COMPARE
Thai
Immigrants from Uruguay
Female Poverty
Female Poverty Comparison
Thais
Immigrants from Uruguay
10.5%
FEMALE POVERTY
100.0/ 100
METRIC RATING
3rd/ 347
METRIC RANK
14.0%
FEMALE POVERTY
14.0/ 100
METRIC RATING
206th/ 347
METRIC RANK
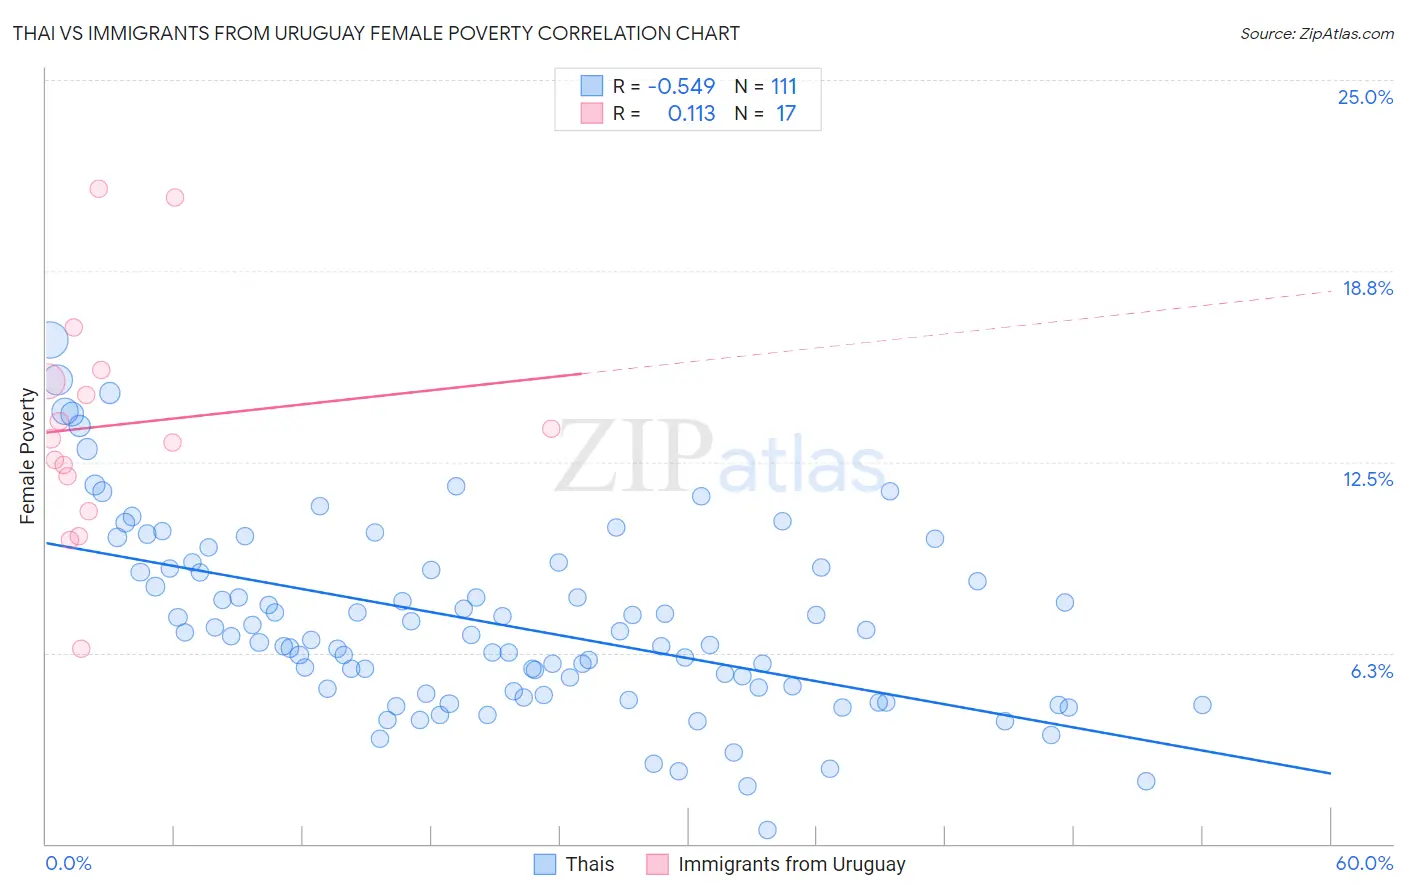
Thai vs Immigrants from Uruguay Female Poverty Correlation Chart
The statistical analysis conducted on geographies consisting of 475,222,247 people shows a substantial negative correlation between the proportion of Thais and poverty level among females in the United States with a correlation coefficient (R) of -0.549 and weighted average of 10.5%. Similarly, the statistical analysis conducted on geographies consisting of 133,241,940 people shows a poor positive correlation between the proportion of Immigrants from Uruguay and poverty level among females in the United States with a correlation coefficient (R) of 0.113 and weighted average of 14.0%, a difference of 34.2%.
Female Poverty Correlation Summary
| Measurement | Thai | Immigrants from Uruguay |
| Minimum | 0.46% | 6.4% |
| Maximum | 16.5% | 21.5% |
| Range | 16.0% | 15.1% |
| Mean | 7.2% | 13.7% |
| Median | 6.8% | 13.3% |
| Interquartile 25% (IQ1) | 5.0% | 11.4% |
| Interquartile 75% (IQ3) | 9.0% | 15.3% |
| Interquartile Range (IQR) | 4.0% | 3.9% |
| Standard Deviation (Sample) | 3.1% | 3.8% |
| Standard Deviation (Population) | 3.0% | 3.7% |
Similar Demographics by Female Poverty
Demographics Similar to Thais by Female Poverty
In terms of female poverty, the demographic groups most similar to Thais are Chinese (10.4%, a difference of 0.65%), Immigrants from Taiwan (10.5%, a difference of 0.76%), Filipino (10.9%, a difference of 4.7%), Immigrants from Ireland (11.0%, a difference of 5.1%), and Assyrian/Chaldean/Syriac (11.0%, a difference of 5.5%).
| Demographics | Rating | Rank | Female Poverty |
| Immigrants | India | 100.0 /100 | #1 | Exceptional 9.9% |
| Chinese | 100.0 /100 | #2 | Exceptional 10.4% |
| Thais | 100.0 /100 | #3 | Exceptional 10.5% |
| Immigrants | Taiwan | 100.0 /100 | #4 | Exceptional 10.5% |
| Filipinos | 100.0 /100 | #5 | Exceptional 10.9% |
| Immigrants | Ireland | 99.9 /100 | #6 | Exceptional 11.0% |
| Assyrians/Chaldeans/Syriacs | 99.9 /100 | #7 | Exceptional 11.0% |
| Immigrants | South Central Asia | 99.9 /100 | #8 | Exceptional 11.1% |
| Bulgarians | 99.9 /100 | #9 | Exceptional 11.1% |
| Immigrants | Hong Kong | 99.9 /100 | #10 | Exceptional 11.2% |
| Maltese | 99.9 /100 | #11 | Exceptional 11.2% |
| Bhutanese | 99.9 /100 | #12 | Exceptional 11.3% |
| Immigrants | Lithuania | 99.9 /100 | #13 | Exceptional 11.3% |
| Lithuanians | 99.8 /100 | #14 | Exceptional 11.4% |
| Latvians | 99.8 /100 | #15 | Exceptional 11.4% |
Demographics Similar to Immigrants from Uruguay by Female Poverty
In terms of female poverty, the demographic groups most similar to Immigrants from Uruguay are Ugandan (14.0%, a difference of 0.27%), Spaniard (13.9%, a difference of 0.84%), Immigrants from Western Asia (13.9%, a difference of 1.1%), Immigrants from Eastern Africa (14.2%, a difference of 1.1%), and Hmong (13.9%, a difference of 1.2%).
| Demographics | Rating | Rank | Female Poverty |
| Immigrants | Lebanon | 25.6 /100 | #199 | Fair 13.8% |
| Spanish | 21.4 /100 | #200 | Fair 13.9% |
| Immigrants | Kenya | 21.1 /100 | #201 | Fair 13.9% |
| Hmong | 21.1 /100 | #202 | Fair 13.9% |
| Immigrants | Western Asia | 20.7 /100 | #203 | Fair 13.9% |
| Spaniards | 18.9 /100 | #204 | Poor 13.9% |
| Ugandans | 15.4 /100 | #205 | Poor 14.0% |
| Immigrants | Uruguay | 14.0 /100 | #206 | Poor 14.0% |
| Immigrants | Eastern Africa | 9.0 /100 | #207 | Tragic 14.2% |
| Immigrants | Azores | 7.9 /100 | #208 | Tragic 14.2% |
| Panamanians | 7.7 /100 | #209 | Tragic 14.2% |
| Malaysians | 7.4 /100 | #210 | Tragic 14.3% |
| Moroccans | 7.2 /100 | #211 | Tragic 14.3% |
| Bermudans | 5.5 /100 | #212 | Tragic 14.4% |
| Alaskan Athabascans | 5.3 /100 | #213 | Tragic 14.4% |