Eastern European vs Immigrants from Uruguay Ambulatory Disability
COMPARE
Eastern European
Immigrants from Uruguay
Ambulatory Disability
Ambulatory Disability Comparison
Eastern Europeans
Immigrants from Uruguay
5.7%
AMBULATORY DISABILITY
99.2/ 100
METRIC RATING
83rd/ 347
METRIC RANK
5.9%
AMBULATORY DISABILITY
95.6/ 100
METRIC RATING
113th/ 347
METRIC RANK
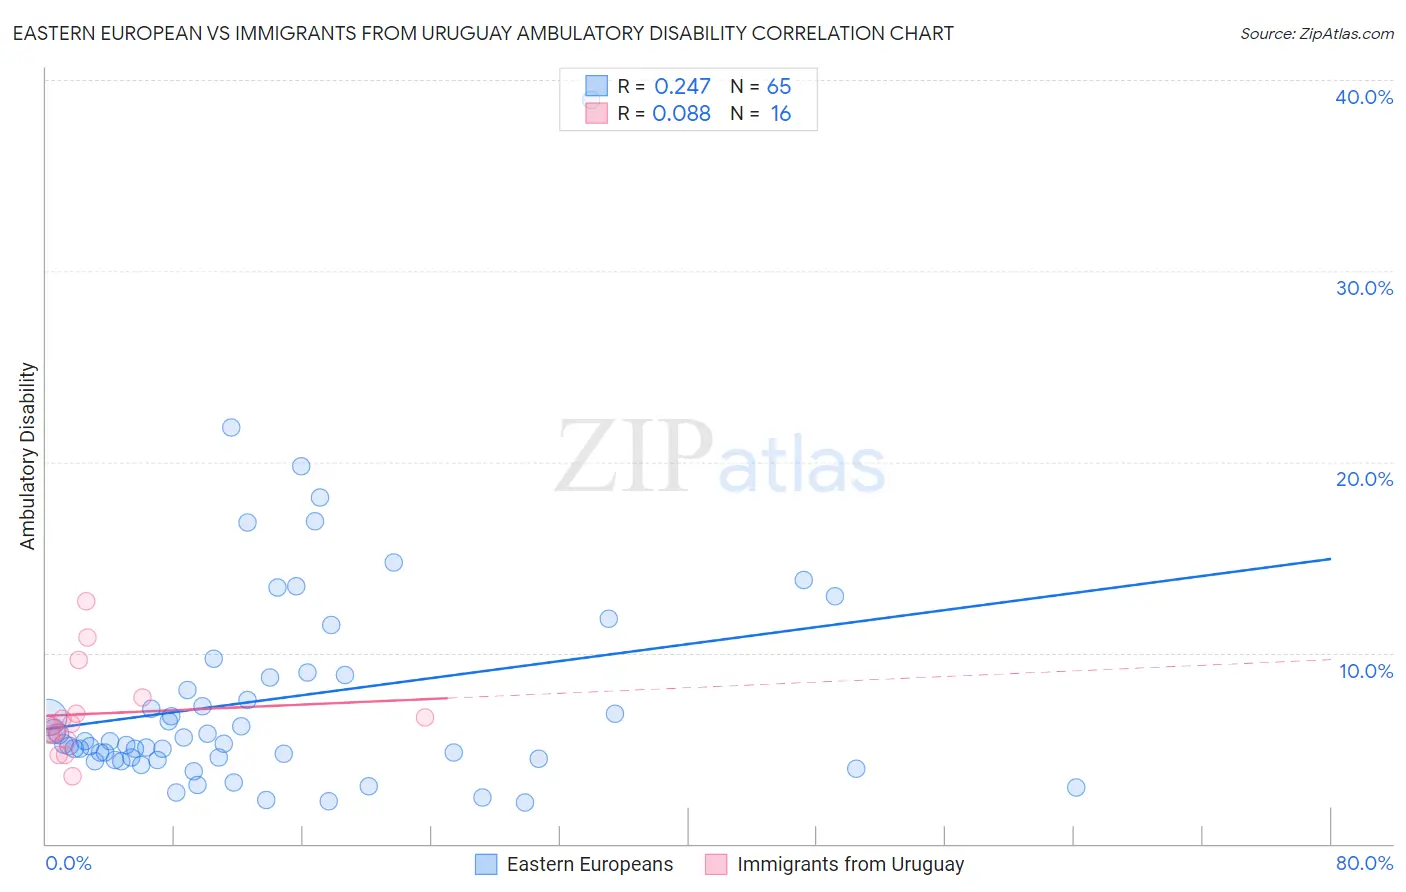
Eastern European vs Immigrants from Uruguay Ambulatory Disability Correlation Chart
The statistical analysis conducted on geographies consisting of 461,048,230 people shows a weak positive correlation between the proportion of Eastern Europeans and percentage of population with ambulatory disability in the United States with a correlation coefficient (R) of 0.247 and weighted average of 5.7%. Similarly, the statistical analysis conducted on geographies consisting of 133,255,356 people shows a slight positive correlation between the proportion of Immigrants from Uruguay and percentage of population with ambulatory disability in the United States with a correlation coefficient (R) of 0.088 and weighted average of 5.9%, a difference of 2.4%.
Ambulatory Disability Correlation Summary
| Measurement | Eastern European | Immigrants from Uruguay |
| Minimum | 2.2% | 3.6% |
| Maximum | 39.0% | 12.7% |
| Range | 36.8% | 9.2% |
| Mean | 7.6% | 6.8% |
| Median | 5.3% | 6.2% |
| Interquartile 25% (IQ1) | 4.4% | 5.6% |
| Interquartile 75% (IQ3) | 8.8% | 7.2% |
| Interquartile Range (IQR) | 4.4% | 1.7% |
| Standard Deviation (Sample) | 6.0% | 2.4% |
| Standard Deviation (Population) | 5.9% | 2.3% |
Similar Demographics by Ambulatory Disability
Demographics Similar to Eastern Europeans by Ambulatory Disability
In terms of ambulatory disability, the demographic groups most similar to Eastern Europeans are Ugandan (5.7%, a difference of 0.0%), Immigrants from Jordan (5.7%, a difference of 0.020%), Palestinian (5.7%, a difference of 0.020%), Immigrants from Ireland (5.7%, a difference of 0.030%), and Chilean (5.7%, a difference of 0.16%).
| Demographics | Rating | Rank | Ambulatory Disability |
| Sudanese | 99.3 /100 | #76 | Exceptional 5.7% |
| Immigrants | Vietnam | 99.3 /100 | #77 | Exceptional 5.7% |
| Somalis | 99.2 /100 | #78 | Exceptional 5.7% |
| Chileans | 99.2 /100 | #79 | Exceptional 5.7% |
| Immigrants | Ireland | 99.2 /100 | #80 | Exceptional 5.7% |
| Immigrants | Jordan | 99.2 /100 | #81 | Exceptional 5.7% |
| Palestinians | 99.2 /100 | #82 | Exceptional 5.7% |
| Eastern Europeans | 99.2 /100 | #83 | Exceptional 5.7% |
| Ugandans | 99.2 /100 | #84 | Exceptional 5.7% |
| South Americans | 99.0 /100 | #85 | Exceptional 5.7% |
| Latvians | 99.0 /100 | #86 | Exceptional 5.7% |
| Immigrants | Chile | 98.9 /100 | #87 | Exceptional 5.8% |
| Soviet Union | 98.9 /100 | #88 | Exceptional 5.8% |
| Bhutanese | 98.8 /100 | #89 | Exceptional 5.8% |
| Australians | 98.8 /100 | #90 | Exceptional 5.8% |
Demographics Similar to Immigrants from Uruguay by Ambulatory Disability
In terms of ambulatory disability, the demographic groups most similar to Immigrants from Uruguay are Immigrants from Poland (5.9%, a difference of 0.060%), South African (5.9%, a difference of 0.22%), South American Indian (5.9%, a difference of 0.26%), Immigrants from Africa (5.9%, a difference of 0.28%), and Danish (5.8%, a difference of 0.35%).
| Demographics | Rating | Rank | Ambulatory Disability |
| Immigrants | Morocco | 97.3 /100 | #106 | Exceptional 5.8% |
| Uruguayans | 97.2 /100 | #107 | Exceptional 5.8% |
| Colombians | 97.2 /100 | #108 | Exceptional 5.8% |
| Immigrants | Netherlands | 97.1 /100 | #109 | Exceptional 5.8% |
| Immigrants | Colombia | 96.7 /100 | #110 | Exceptional 5.8% |
| Danes | 96.6 /100 | #111 | Exceptional 5.8% |
| South Africans | 96.3 /100 | #112 | Exceptional 5.9% |
| Immigrants | Uruguay | 95.6 /100 | #113 | Exceptional 5.9% |
| Immigrants | Poland | 95.4 /100 | #114 | Exceptional 5.9% |
| South American Indians | 94.8 /100 | #115 | Exceptional 5.9% |
| Immigrants | Africa | 94.7 /100 | #116 | Exceptional 5.9% |
| Immigrants | South Eastern Asia | 93.6 /100 | #117 | Exceptional 5.9% |
| Russians | 93.4 /100 | #118 | Exceptional 5.9% |
| Norwegians | 93.1 /100 | #119 | Exceptional 5.9% |
| Estonians | 92.9 /100 | #120 | Exceptional 5.9% |