Thai vs Cypriot Vision Disability

COMPARE

Thai
Race
Ancestry
AfghanAfricanAlaska NativeAlaskan AthabascanAlbanianAleutAlsatianAmericanApacheArabArapahoArgentineanArmenianAssyrian/Chaldean/SyriacAustralianAustrianBahamianBangladeshiBarbadianBasqueBelgianBelizeanBermudanBhutaneseBlackfeetBolivianBrazilianBritishBritish West IndianBulgarianBurmeseCajunCambodianCanadianCape VerdeanCarpatho RusynCelticCentral AmericanCentral American IndianCherokeeCheyenneChickasawChileanChineseChippewaChoctawColombianColvilleComancheCosta RicanCreeCreekCroatianCrowCubanCzechCzechoslovakianDanishDelawareDominicanDutchDutch West IndianEastern EuropeanEcuadorianEgyptianEnglishEstonianEthiopianEuropeanFijianFilipinoFinnishFrenchFrench American IndianFrench CanadianGermanGerman RussianGhanaianGreekGuamanian/ChamorroGuatemalanGuyaneseHaitianHmongHonduranHopiHoumaHungarianIcelanderIndian (Asian)IndonesianInupiatIranianIraqiIrishIroquoisIsraeliItalianJamaicanJapaneseJordanianKenyanKiowaKoreanLaotianLatvianLebaneseLiberianLithuanianLumbeeLuxembourgerMacedonianMalaysianMalteseMarshalleseMenomineeMexicanMexican American IndianMongolianMoroccanNative HawaiianNavajoNepaleseNew ZealanderNicaraguanNigerianNorthern EuropeanNorwegianOkinawanOsageOttawaPaiutePakistaniPalestinianPanamanianParaguayanPennsylvania GermanPeruvianPimaPolishPortuguesePotawatomiPuebloPuerto RicanPuget Sound SalishRomanianRussianSalvadoranSamoanScandinavianScotch-IrishScottishSeminoleSenegaleseSerbianShoshoneSierra LeoneanSiouxSlavicSlovakSloveneSomaliSouth AfricanSouth AmericanSouth American IndianSoviet UnionSpaniardSpanishSpanish AmericanSpanish American IndianSri LankanSubsaharan AfricanSudaneseSwedishSwissSyrianTaiwaneseThaiTlingit-HaidaTohono O'OdhamTonganTrinidadian and TobagonianTsimshianTurkishU.S. Virgin IslanderUgandanUkrainianUruguayanUteVenezuelanVietnameseWelshWest IndianYakamaYaquiYugoslavianYumanYup'ikZimbabwean
Immigration
NonimmigrantsImmigrantsAfghanistanAfricaAlbaniaArgentinaArmeniaAsiaAustraliaAustriaBahamasBangladeshBarbadosBelarusBelgiumBelizeBoliviaBosnia and HerzegovinaBrazilBulgariaBurma/MyanmarCabo VerdeCambodiaCameroonCanadaCaribbeanCentral AmericaChileChinaColombiaCongoCosta RicaCroatiaCubaCzechoslovakiaDenmarkDominicaDominican RepublicEastern AfricaEastern AsiaEastern EuropeEcuadorEgyptEl SalvadorEnglandEritreaEthiopiaEuropeFijiFranceGermanyGhanaGreeceGrenadaGuatemalaGuyanaHaitiHondurasHong KongHungaryIndiaIndonesiaIranIraqIrelandIsraelItalyJamaicaJapanJordanKazakhstanKenyaKoreaKuwaitLaosLatin AmericaLatviaLebanonLiberiaLithuaniaMalaysiaMexicoMicronesiaMiddle AfricaMoldovaMoroccoNepalNetherlandsNicaraguaNigeriaNorth AmericaNorth MacedoniaNorthern AfricaNorthern EuropeNorwayOceaniaPakistanPanamaPeruPhilippinesPolandPortugalRomaniaRussiaSaudi ArabiaScotlandSenegalSerbiaSierra LeoneSingaporeSomaliaSouth AfricaSouth AmericaSouth Central AsiaSouth Eastern AsiaSouthern EuropeSpainSri LankaSt. Vincent and the GrenadinesSudanSwedenSwitzerlandSyriaTaiwanThailandTrinidad and TobagoTurkeyUgandaUkraineUruguayUzbekistanVenezuelaVietnamWest IndiesWestern AfricaWestern AsiaWestern EuropeYemenZaireZimbabweAzores
Cypriot
Race
Ancestry
AfghanAfricanAlaska NativeAlaskan AthabascanAlbanianAleutAlsatianAmericanApacheArabArapahoArgentineanArmenianAssyrian/Chaldean/SyriacAustralianAustrianBahamianBangladeshiBarbadianBasqueBelgianBelizeanBermudanBhutaneseBlackfeetBolivianBrazilianBritishBritish West IndianBulgarianBurmeseCajunCambodianCanadianCape VerdeanCarpatho RusynCelticCentral AmericanCentral American IndianCherokeeCheyenneChickasawChileanChineseChippewaChoctawColombianColvilleComancheCosta RicanCreeCreekCroatianCrowCubanCypriotCzechCzechoslovakianDanishDelawareDominicanDutchDutch West IndianEastern EuropeanEcuadorianEgyptianEnglishEstonianEthiopianEuropeanFijianFilipinoFinnishFrenchFrench American IndianFrench CanadianGermanGerman RussianGhanaianGreekGuamanian/ChamorroGuatemalanGuyaneseHaitianHmongHonduranHopiHoumaHungarianIcelanderIndian (Asian)IndonesianInupiatIranianIraqiIrishIroquoisIsraeliItalianJamaicanJapaneseJordanianKenyanKiowaKoreanLaotianLatvianLebaneseLiberianLithuanianLumbeeLuxembourgerMacedonianMalaysianMalteseMarshalleseMenomineeMexicanMexican American IndianMongolianMoroccanNative HawaiianNavajoNepaleseNew ZealanderNicaraguanNigerianNorthern EuropeanNorwegianOkinawanOsageOttawaPaiutePakistaniPalestinianPanamanianParaguayanPennsylvania GermanPeruvianPimaPolishPortuguesePotawatomiPuebloPuerto RicanPuget Sound SalishRomanianRussianSalvadoranSamoanScandinavianScotch-IrishScottishSeminoleSenegaleseSerbianShoshoneSierra LeoneanSiouxSlavicSlovakSloveneSomaliSouth AfricanSouth AmericanSouth American IndianSoviet UnionSpaniardSpanishSpanish AmericanSpanish American IndianSri LankanSubsaharan AfricanSudaneseSwedishSwissSyrianTaiwaneseTlingit-HaidaTohono O'OdhamTonganTrinidadian and TobagonianTsimshianTurkishU.S. Virgin IslanderUgandanUkrainianUruguayanUteVenezuelanVietnameseWelshWest IndianYakamaYaquiYugoslavianYumanYup'ikZimbabwean
Immigration
NonimmigrantsImmigrantsAfghanistanAfricaAlbaniaArgentinaArmeniaAsiaAustraliaAustriaBahamasBangladeshBarbadosBelarusBelgiumBelizeBoliviaBosnia and HerzegovinaBrazilBulgariaBurma/MyanmarCabo VerdeCambodiaCameroonCanadaCaribbeanCentral AmericaChileChinaColombiaCongoCosta RicaCroatiaCubaCzechoslovakiaDenmarkDominicaDominican RepublicEastern AfricaEastern AsiaEastern EuropeEcuadorEgyptEl SalvadorEnglandEritreaEthiopiaEuropeFijiFranceGermanyGhanaGreeceGrenadaGuatemalaGuyanaHaitiHondurasHong KongHungaryIndiaIndonesiaIranIraqIrelandIsraelItalyJamaicaJapanJordanKazakhstanKenyaKoreaKuwaitLaosLatin AmericaLatviaLebanonLiberiaLithuaniaMalaysiaMexicoMicronesiaMiddle AfricaMoldovaMoroccoNepalNetherlandsNicaraguaNigeriaNorth AmericaNorth MacedoniaNorthern AfricaNorthern EuropeNorwayOceaniaPakistanPanamaPeruPhilippinesPolandPortugalRomaniaRussiaSaudi ArabiaScotlandSenegalSerbiaSierra LeoneSingaporeSomaliaSouth AfricaSouth AmericaSouth Central AsiaSouth Eastern AsiaSouthern EuropeSpainSri LankaSt. Vincent and the GrenadinesSudanSwedenSwitzerlandSyriaTaiwanThailandTrinidad and TobagoTurkeyUgandaUkraineUruguayUzbekistanVenezuelaVietnamWest IndiesWestern AfricaWestern AsiaWestern EuropeYemenZaireZimbabweAzores
Vision Disability
Income
Poverty
Unemployment
Labor Participation
Family Structure
Vehicle Availability
Education Level
Disability

Vision Disability Comparison

Thais

Cypriots

Exceptional
Exceptional
1.7%
VISION DISABILITY
100.0/ 100
METRIC RATING
4th/ 347
METRIC RANK
2.0%
VISION DISABILITY
99.7/ 100
METRIC RATING
41st/ 347
METRIC RANK

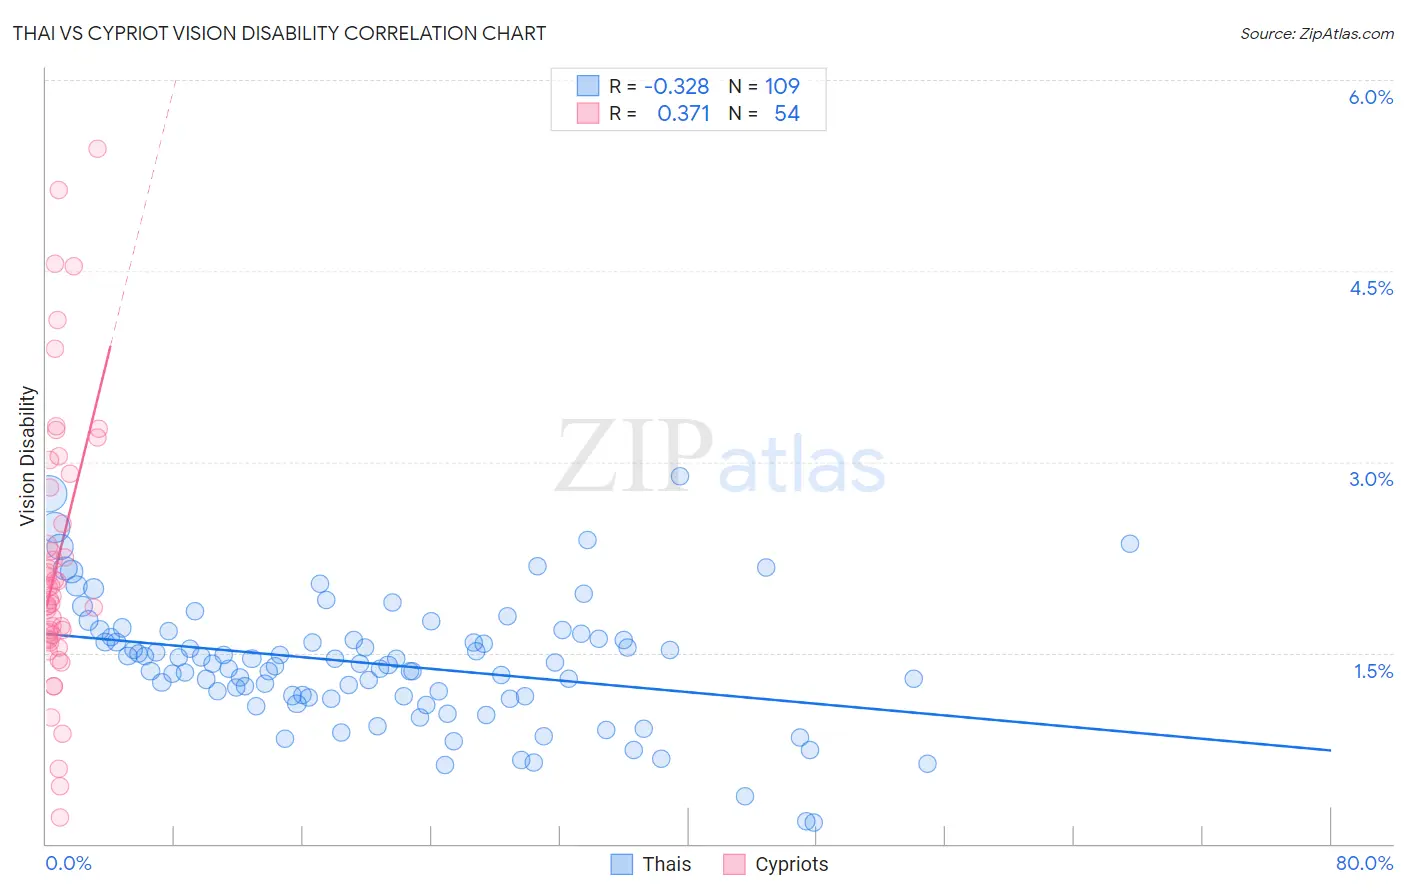
Thai vs Cypriot Vision Disability Correlation Chart

The statistical analysis conducted on geographies consisting of 475,304,455 people shows a mild negative correlation between the proportion of Thais and percentage of population with vision disability in the United States with a correlation coefficient (R) of -0.328 and weighted average of 1.7%. Similarly, the statistical analysis conducted on geographies consisting of 61,856,516 people shows a mild positive correlation between the proportion of Cypriots and percentage of population with vision disability in the United States with a correlation coefficient (R) of 0.371 and weighted average of 2.0%, a difference of 13.0%.
Thai vs Cypriot Vision Disability

Vision Disability Correlation Summary

MeasurementThaiCypriot
Minimum0.17%0.21%
Maximum2.9%5.5%
Range2.7%5.3%
Mean1.4%2.2%
Median1.4%1.9%
Interquartile 25% (IQ1)1.2%1.6%
Interquartile 75% (IQ3)1.6%2.8%
Interquartile Range (IQR)0.47%1.2%
Standard Deviation (Sample)0.49%1.1%
Standard Deviation (Population)0.48%1.1%

Similar Demographics by Vision Disability

Demographics Similar to Thais by Vision Disability

In terms of vision disability, the demographic groups most similar to Thais are Okinawan (1.8%, a difference of 1.9%), Immigrants from Iran (1.8%, a difference of 2.5%), Immigrants from South Central Asia (1.8%, a difference of 2.6%), Immigrants from Taiwan (1.7%, a difference of 2.6%), and Iranian (1.8%, a difference of 2.7%).
DemographicsRating | RankVision Disability
Immigrants | India
100.0
/100
|
#1
Exceptional
1.7%
Filipinos
100.0
/100
|
#2
Exceptional
1.7%
Immigrants | Taiwan
100.0
/100
|
#3
Exceptional
1.7%
Thais
100.0
/100
|
#4
Exceptional
1.7%
Okinawans
100.0
/100
|
#5
Exceptional
1.8%
Immigrants | Iran
100.0
/100
|
#6
Exceptional
1.8%
Immigrants | South Central Asia
100.0
/100
|
#7
Exceptional
1.8%
Iranians
100.0
/100
|
#8
Exceptional
1.8%
Immigrants | Singapore
100.0
/100
|
#9
Exceptional
1.8%
Immigrants | Hong Kong
100.0
/100
|
#10
Exceptional
1.8%
Immigrants | Israel
100.0
/100
|
#11
Exceptional
1.8%
Immigrants | Korea
100.0
/100
|
#12
Exceptional
1.8%
Immigrants | Eastern Asia
100.0
/100
|
#13
Exceptional
1.8%
Immigrants | China
100.0
/100
|
#14
Exceptional
1.8%
Immigrants | Bolivia
100.0
/100
|
#15
Exceptional
1.8%

Demographics Similar to Cypriots by Vision Disability

In terms of vision disability, the demographic groups most similar to Cypriots are Immigrants from Ireland (2.0%, a difference of 0.030%), Immigrants from Ethiopia (2.0%, a difference of 0.16%), Zimbabwean (2.0%, a difference of 0.22%), Eastern European (2.0%, a difference of 0.22%), and Immigrants from Indonesia (2.0%, a difference of 0.24%).
DemographicsRating | RankVision Disability
Immigrants | Turkey
99.8
/100
|
#34
Exceptional
1.9%
Immigrants | Australia
99.8
/100
|
#35
Exceptional
1.9%
Cambodians
99.8
/100
|
#36
Exceptional
2.0%
Bhutanese
99.8
/100
|
#37
Exceptional
2.0%
Immigrants | Kuwait
99.8
/100
|
#38
Exceptional
2.0%
Zimbabweans
99.7
/100
|
#39
Exceptional
2.0%
Immigrants | Ireland
99.7
/100
|
#40
Exceptional
2.0%
Cypriots
99.7
/100
|
#41
Exceptional
2.0%
Immigrants | Ethiopia
99.7
/100
|
#42
Exceptional
2.0%
Eastern Europeans
99.7
/100
|
#43
Exceptional
2.0%
Immigrants | Indonesia
99.7
/100
|
#44
Exceptional
2.0%
Ethiopians
99.7
/100
|
#45
Exceptional
2.0%
Immigrants | Sweden
99.7
/100
|
#46
Exceptional
2.0%
Immigrants | Bulgaria
99.7
/100
|
#47
Exceptional
2.0%
Israelis
99.6
/100
|
#48
Exceptional
2.0%