Thai vs Ukrainian Vision Disability
COMPARE
Thai
Ukrainian
Vision Disability
Vision Disability Comparison
Thais
Ukrainians
1.7%
VISION DISABILITY
100.0/ 100
METRIC RATING
4th/ 347
METRIC RANK
2.1%
VISION DISABILITY
81.9/ 100
METRIC RATING
144th/ 347
METRIC RANK
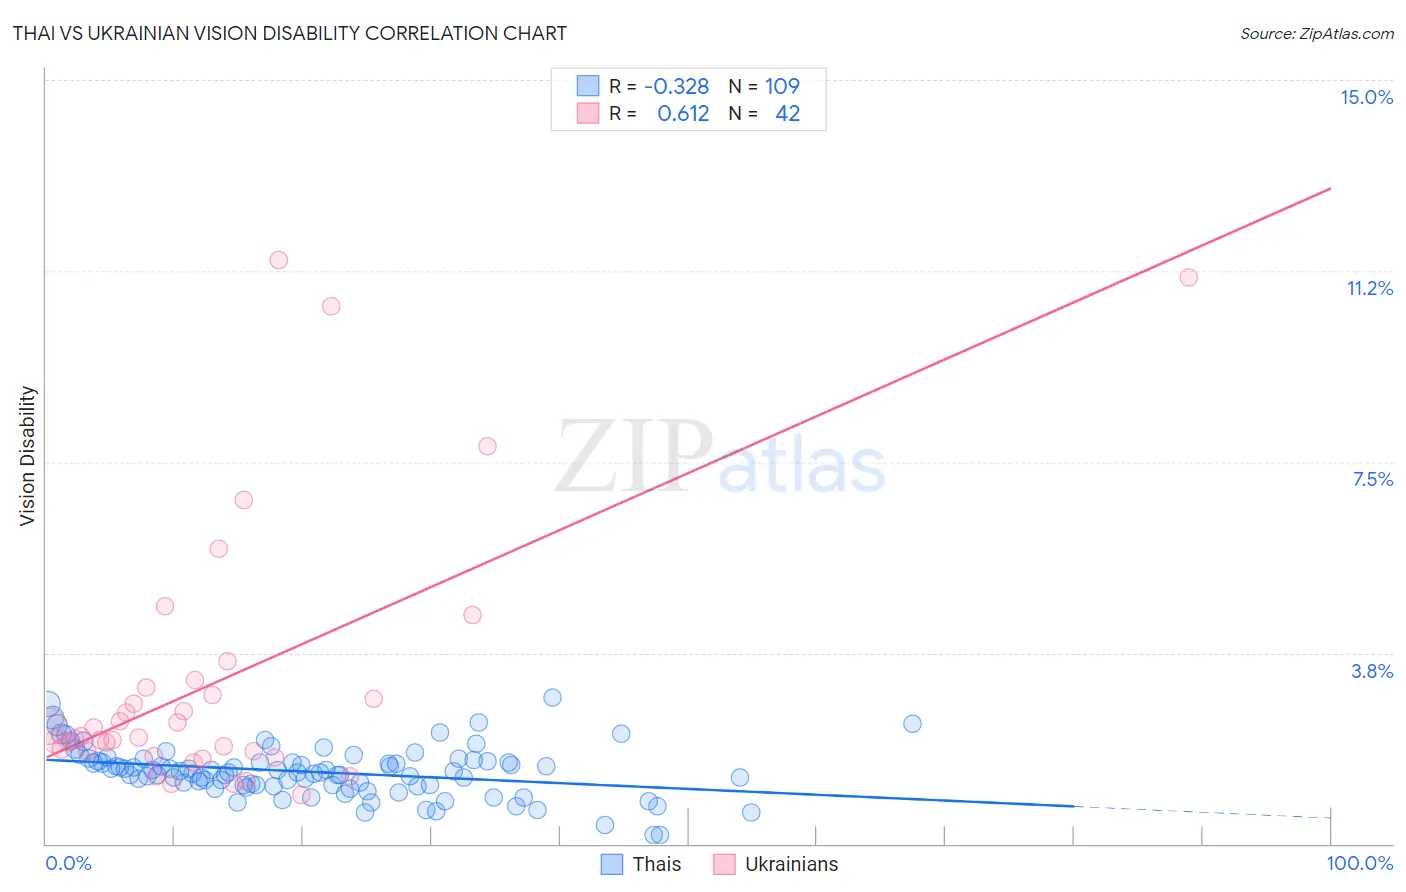
Thai vs Ukrainian Vision Disability Correlation Chart
The statistical analysis conducted on geographies consisting of 475,304,455 people shows a mild negative correlation between the proportion of Thais and percentage of population with vision disability in the United States with a correlation coefficient (R) of -0.328 and weighted average of 1.7%. Similarly, the statistical analysis conducted on geographies consisting of 448,040,924 people shows a significant positive correlation between the proportion of Ukrainians and percentage of population with vision disability in the United States with a correlation coefficient (R) of 0.612 and weighted average of 2.1%, a difference of 21.5%.
Vision Disability Correlation Summary
| Measurement | Thai | Ukrainian |
| Minimum | 0.17% | 0.95% |
| Maximum | 2.9% | 11.5% |
| Range | 2.7% | 10.5% |
| Mean | 1.4% | 3.2% |
| Median | 1.4% | 2.1% |
| Interquartile 25% (IQ1) | 1.2% | 1.8% |
| Interquartile 75% (IQ3) | 1.6% | 3.1% |
| Interquartile Range (IQR) | 0.47% | 1.2% |
| Standard Deviation (Sample) | 0.49% | 2.6% |
| Standard Deviation (Population) | 0.48% | 2.6% |
Similar Demographics by Vision Disability
Demographics Similar to Thais by Vision Disability
In terms of vision disability, the demographic groups most similar to Thais are Okinawan (1.8%, a difference of 1.9%), Immigrants from Iran (1.8%, a difference of 2.5%), Immigrants from South Central Asia (1.8%, a difference of 2.6%), Immigrants from Taiwan (1.7%, a difference of 2.6%), and Iranian (1.8%, a difference of 2.7%).
| Demographics | Rating | Rank | Vision Disability |
| Immigrants | India | 100.0 /100 | #1 | Exceptional 1.7% |
| Filipinos | 100.0 /100 | #2 | Exceptional 1.7% |
| Immigrants | Taiwan | 100.0 /100 | #3 | Exceptional 1.7% |
| Thais | 100.0 /100 | #4 | Exceptional 1.7% |
| Okinawans | 100.0 /100 | #5 | Exceptional 1.8% |
| Immigrants | Iran | 100.0 /100 | #6 | Exceptional 1.8% |
| Immigrants | South Central Asia | 100.0 /100 | #7 | Exceptional 1.8% |
| Iranians | 100.0 /100 | #8 | Exceptional 1.8% |
| Immigrants | Singapore | 100.0 /100 | #9 | Exceptional 1.8% |
| Immigrants | Hong Kong | 100.0 /100 | #10 | Exceptional 1.8% |
| Immigrants | Israel | 100.0 /100 | #11 | Exceptional 1.8% |
| Immigrants | Korea | 100.0 /100 | #12 | Exceptional 1.8% |
| Immigrants | Eastern Asia | 100.0 /100 | #13 | Exceptional 1.8% |
| Immigrants | China | 100.0 /100 | #14 | Exceptional 1.8% |
| Immigrants | Bolivia | 100.0 /100 | #15 | Exceptional 1.8% |
Demographics Similar to Ukrainians by Vision Disability
In terms of vision disability, the demographic groups most similar to Ukrainians are Immigrants from Bosnia and Herzegovina (2.1%, a difference of 0.040%), South American (2.1%, a difference of 0.11%), Immigrants from Sierra Leone (2.1%, a difference of 0.11%), Italian (2.1%, a difference of 0.23%), and Sierra Leonean (2.1%, a difference of 0.25%).
| Demographics | Rating | Rank | Vision Disability |
| Immigrants | South Eastern Asia | 86.3 /100 | #137 | Excellent 2.1% |
| Arabs | 86.3 /100 | #138 | Excellent 2.1% |
| Immigrants | Morocco | 85.2 /100 | #139 | Excellent 2.1% |
| Immigrants | Netherlands | 84.2 /100 | #140 | Excellent 2.1% |
| Sierra Leoneans | 84.1 /100 | #141 | Excellent 2.1% |
| South Americans | 82.8 /100 | #142 | Excellent 2.1% |
| Immigrants | Sierra Leone | 82.8 /100 | #143 | Excellent 2.1% |
| Ukrainians | 81.9 /100 | #144 | Excellent 2.1% |
| Immigrants | Bosnia and Herzegovina | 81.5 /100 | #145 | Excellent 2.1% |
| Italians | 79.7 /100 | #146 | Good 2.1% |
| Immigrants | Sudan | 78.4 /100 | #147 | Good 2.1% |
| Finns | 78.3 /100 | #148 | Good 2.1% |
| Colombians | 76.2 /100 | #149 | Good 2.1% |
| Belgians | 75.9 /100 | #150 | Good 2.1% |
| Immigrants | Norway | 75.5 /100 | #151 | Good 2.1% |