Thai vs Immigrants from Haiti Vision Disability
COMPARE
Thai
Immigrants from Haiti
Vision Disability
Vision Disability Comparison
Thais
Immigrants from Haiti
1.7%
VISION DISABILITY
100.0/ 100
METRIC RATING
4th/ 347
METRIC RANK
2.4%
VISION DISABILITY
0.2/ 100
METRIC RATING
256th/ 347
METRIC RANK
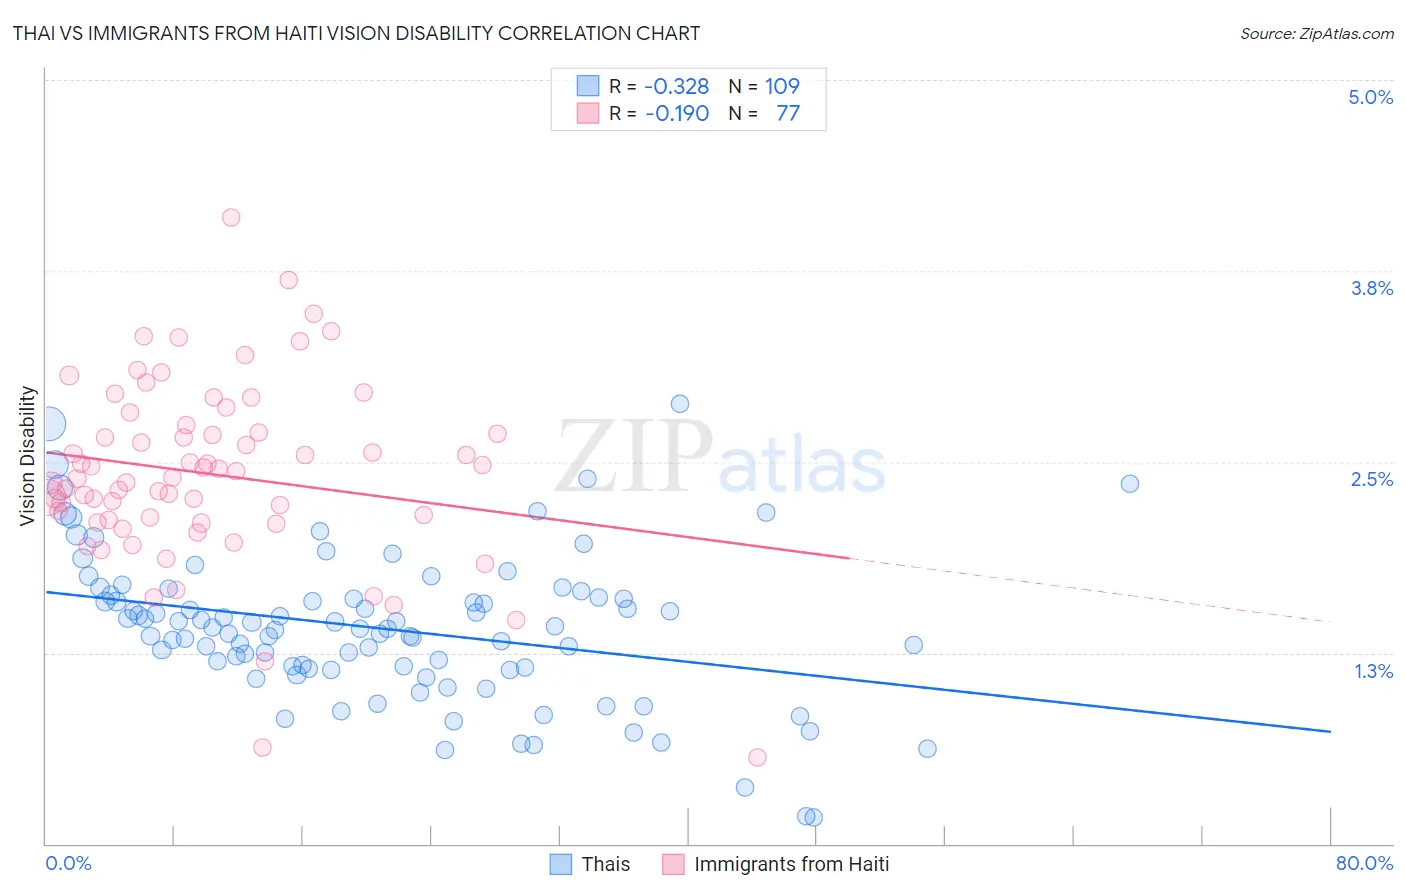
Thai vs Immigrants from Haiti Vision Disability Correlation Chart
The statistical analysis conducted on geographies consisting of 475,304,455 people shows a mild negative correlation between the proportion of Thais and percentage of population with vision disability in the United States with a correlation coefficient (R) of -0.328 and weighted average of 1.7%. Similarly, the statistical analysis conducted on geographies consisting of 225,143,301 people shows a poor negative correlation between the proportion of Immigrants from Haiti and percentage of population with vision disability in the United States with a correlation coefficient (R) of -0.190 and weighted average of 2.4%, a difference of 36.5%.
Vision Disability Correlation Summary
| Measurement | Thai | Immigrants from Haiti |
| Minimum | 0.17% | 0.56% |
| Maximum | 2.9% | 4.1% |
| Range | 2.7% | 3.5% |
| Mean | 1.4% | 2.4% |
| Median | 1.4% | 2.4% |
| Interquartile 25% (IQ1) | 1.2% | 2.1% |
| Interquartile 75% (IQ3) | 1.6% | 2.7% |
| Interquartile Range (IQR) | 0.47% | 0.60% |
| Standard Deviation (Sample) | 0.49% | 0.60% |
| Standard Deviation (Population) | 0.48% | 0.60% |
Similar Demographics by Vision Disability
Demographics Similar to Thais by Vision Disability
In terms of vision disability, the demographic groups most similar to Thais are Okinawan (1.8%, a difference of 1.9%), Immigrants from Iran (1.8%, a difference of 2.5%), Immigrants from South Central Asia (1.8%, a difference of 2.6%), Immigrants from Taiwan (1.7%, a difference of 2.6%), and Iranian (1.8%, a difference of 2.7%).
| Demographics | Rating | Rank | Vision Disability |
| Immigrants | India | 100.0 /100 | #1 | Exceptional 1.7% |
| Filipinos | 100.0 /100 | #2 | Exceptional 1.7% |
| Immigrants | Taiwan | 100.0 /100 | #3 | Exceptional 1.7% |
| Thais | 100.0 /100 | #4 | Exceptional 1.7% |
| Okinawans | 100.0 /100 | #5 | Exceptional 1.8% |
| Immigrants | Iran | 100.0 /100 | #6 | Exceptional 1.8% |
| Immigrants | South Central Asia | 100.0 /100 | #7 | Exceptional 1.8% |
| Iranians | 100.0 /100 | #8 | Exceptional 1.8% |
| Immigrants | Singapore | 100.0 /100 | #9 | Exceptional 1.8% |
| Immigrants | Hong Kong | 100.0 /100 | #10 | Exceptional 1.8% |
| Immigrants | Israel | 100.0 /100 | #11 | Exceptional 1.8% |
| Immigrants | Korea | 100.0 /100 | #12 | Exceptional 1.8% |
| Immigrants | Eastern Asia | 100.0 /100 | #13 | Exceptional 1.8% |
| Immigrants | China | 100.0 /100 | #14 | Exceptional 1.8% |
| Immigrants | Bolivia | 100.0 /100 | #15 | Exceptional 1.8% |
Demographics Similar to Immigrants from Haiti by Vision Disability
In terms of vision disability, the demographic groups most similar to Immigrants from Haiti are West Indian (2.4%, a difference of 0.080%), British West Indian (2.4%, a difference of 0.10%), White/Caucasian (2.4%, a difference of 0.12%), Belizean (2.4%, a difference of 0.29%), and Immigrants from Guatemala (2.4%, a difference of 0.33%).
| Demographics | Rating | Rank | Vision Disability |
| Liberians | 0.5 /100 | #249 | Tragic 2.3% |
| Bangladeshis | 0.5 /100 | #250 | Tragic 2.3% |
| Immigrants | Laos | 0.4 /100 | #251 | Tragic 2.4% |
| Immigrants | Micronesia | 0.3 /100 | #252 | Tragic 2.4% |
| Japanese | 0.3 /100 | #253 | Tragic 2.4% |
| Haitians | 0.3 /100 | #254 | Tragic 2.4% |
| Immigrants | Guatemala | 0.3 /100 | #255 | Tragic 2.4% |
| Immigrants | Haiti | 0.2 /100 | #256 | Tragic 2.4% |
| West Indians | 0.2 /100 | #257 | Tragic 2.4% |
| British West Indians | 0.2 /100 | #258 | Tragic 2.4% |
| Whites/Caucasians | 0.2 /100 | #259 | Tragic 2.4% |
| Belizeans | 0.2 /100 | #260 | Tragic 2.4% |
| Fijians | 0.1 /100 | #261 | Tragic 2.4% |
| Jamaicans | 0.1 /100 | #262 | Tragic 2.4% |
| Immigrants | Belize | 0.1 /100 | #263 | Tragic 2.4% |