French American Indian vs Crow Ambulatory Disability
COMPARE
French American Indian
Crow
Ambulatory Disability
Ambulatory Disability Comparison
French American Indians
Crow
6.9%
AMBULATORY DISABILITY
0.0/ 100
METRIC RATING
297th/ 347
METRIC RANK
6.9%
AMBULATORY DISABILITY
0.0/ 100
METRIC RATING
295th/ 347
METRIC RANK
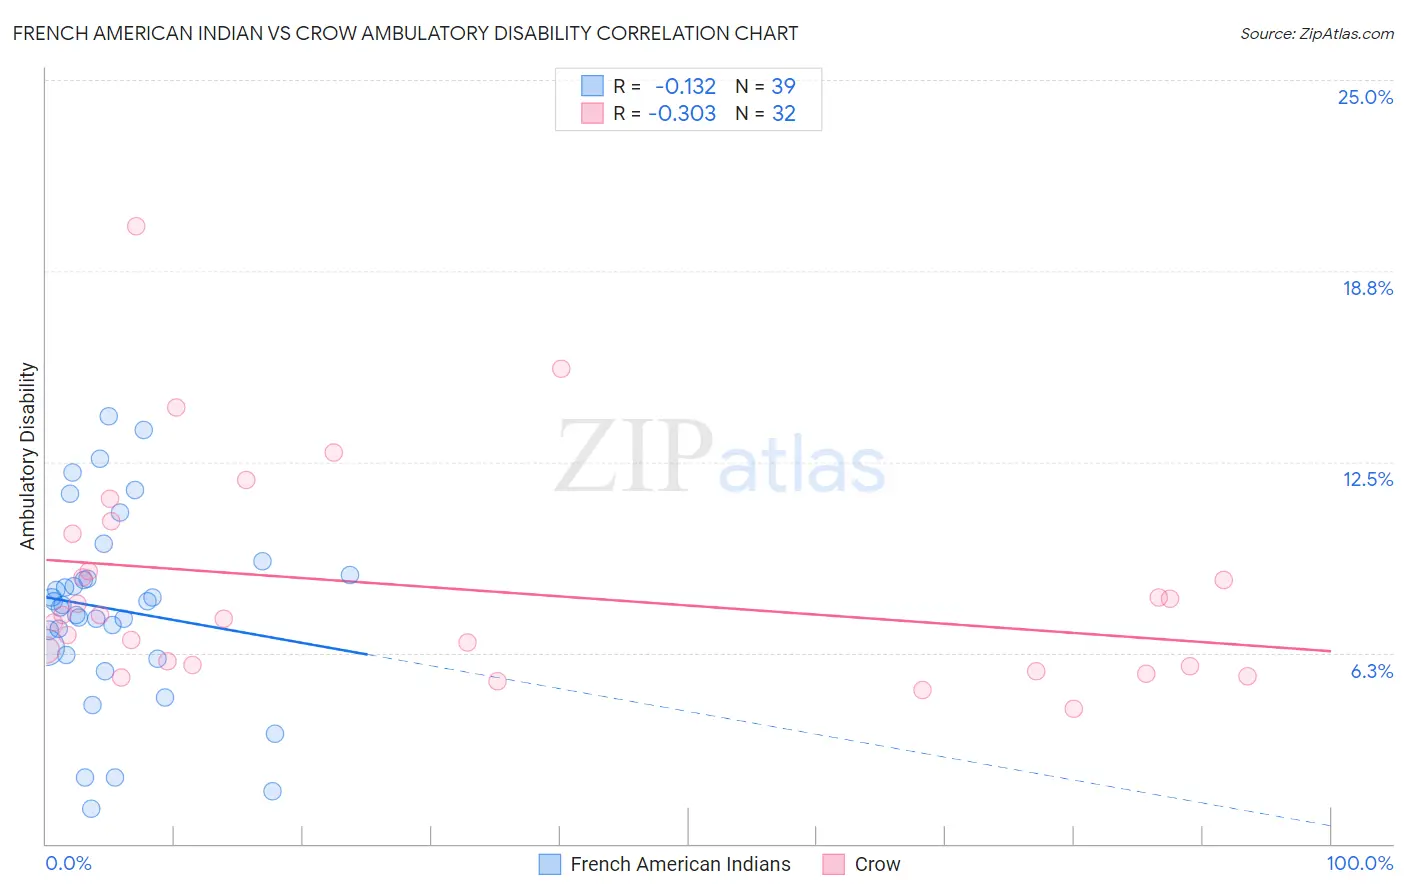
French American Indian vs Crow Ambulatory Disability Correlation Chart
The statistical analysis conducted on geographies consisting of 131,970,739 people shows a poor negative correlation between the proportion of French American Indians and percentage of population with ambulatory disability in the United States with a correlation coefficient (R) of -0.132 and weighted average of 6.9%. Similarly, the statistical analysis conducted on geographies consisting of 59,204,118 people shows a mild negative correlation between the proportion of Crow and percentage of population with ambulatory disability in the United States with a correlation coefficient (R) of -0.303 and weighted average of 6.9%, a difference of 0.40%.
Ambulatory Disability Correlation Summary
| Measurement | French American Indian | Crow |
| Minimum | 1.2% | 4.4% |
| Maximum | 14.0% | 20.2% |
| Range | 12.8% | 15.8% |
| Mean | 7.7% | 8.4% |
| Median | 7.8% | 7.4% |
| Interquartile 25% (IQ1) | 6.2% | 5.8% |
| Interquartile 75% (IQ3) | 8.8% | 9.5% |
| Interquartile Range (IQR) | 2.6% | 3.7% |
| Standard Deviation (Sample) | 3.1% | 3.5% |
| Standard Deviation (Population) | 3.0% | 3.4% |
Demographics Similar to French American Indians and Crow by Ambulatory Disability
In terms of ambulatory disability, the demographic groups most similar to French American Indians are Immigrants from Grenada (6.9%, a difference of 0.010%), Puget Sound Salish (6.9%, a difference of 0.14%), Marshallese (6.9%, a difference of 0.15%), Alaskan Athabascan (6.9%, a difference of 0.17%), and British West Indian (7.0%, a difference of 0.38%). Similarly, the demographic groups most similar to Crow are Cape Verdean (6.9%, a difference of 0.070%), Alaskan Athabascan (6.9%, a difference of 0.23%), Immigrants from St. Vincent and the Grenadines (6.9%, a difference of 0.26%), Immigrants from Grenada (6.9%, a difference of 0.41%), and Cheyenne (6.9%, a difference of 0.49%).
| Demographics | Rating | Rank | Ambulatory Disability |
| Yakama | 0.0 /100 | #286 | Tragic 6.8% |
| U.S. Virgin Islanders | 0.0 /100 | #287 | Tragic 6.8% |
| Immigrants | Nonimmigrants | 0.0 /100 | #288 | Tragic 6.9% |
| Immigrants | Dominica | 0.0 /100 | #289 | Tragic 6.9% |
| Scotch-Irish | 0.0 /100 | #290 | Tragic 6.9% |
| West Indians | 0.0 /100 | #291 | Tragic 6.9% |
| Cheyenne | 0.0 /100 | #292 | Tragic 6.9% |
| Immigrants | St. Vincent and the Grenadines | 0.0 /100 | #293 | Tragic 6.9% |
| Cape Verdeans | 0.0 /100 | #294 | Tragic 6.9% |
| Crow | 0.0 /100 | #295 | Tragic 6.9% |
| Alaskan Athabascans | 0.0 /100 | #296 | Tragic 6.9% |
| French American Indians | 0.0 /100 | #297 | Tragic 6.9% |
| Immigrants | Grenada | 0.0 /100 | #298 | Tragic 6.9% |
| Puget Sound Salish | 0.0 /100 | #299 | Tragic 6.9% |
| Marshallese | 0.0 /100 | #300 | Tragic 6.9% |
| British West Indians | 0.0 /100 | #301 | Tragic 7.0% |
| Immigrants | Armenia | 0.0 /100 | #302 | Tragic 7.0% |
| Africans | 0.0 /100 | #303 | Tragic 7.0% |
| Immigrants | Cabo Verde | 0.0 /100 | #304 | Tragic 7.0% |
| Immigrants | Micronesia | 0.0 /100 | #305 | Tragic 7.0% |
| Iroquois | 0.0 /100 | #306 | Tragic 7.1% |