Immigrants from Eritrea vs Crow Ambulatory Disability
COMPARE
Immigrants from Eritrea
Crow
Ambulatory Disability
Ambulatory Disability Comparison
Immigrants from Eritrea
Crow
5.5%
AMBULATORY DISABILITY
100.0/ 100
METRIC RATING
39th/ 347
METRIC RANK
6.9%
AMBULATORY DISABILITY
0.0/ 100
METRIC RATING
295th/ 347
METRIC RANK
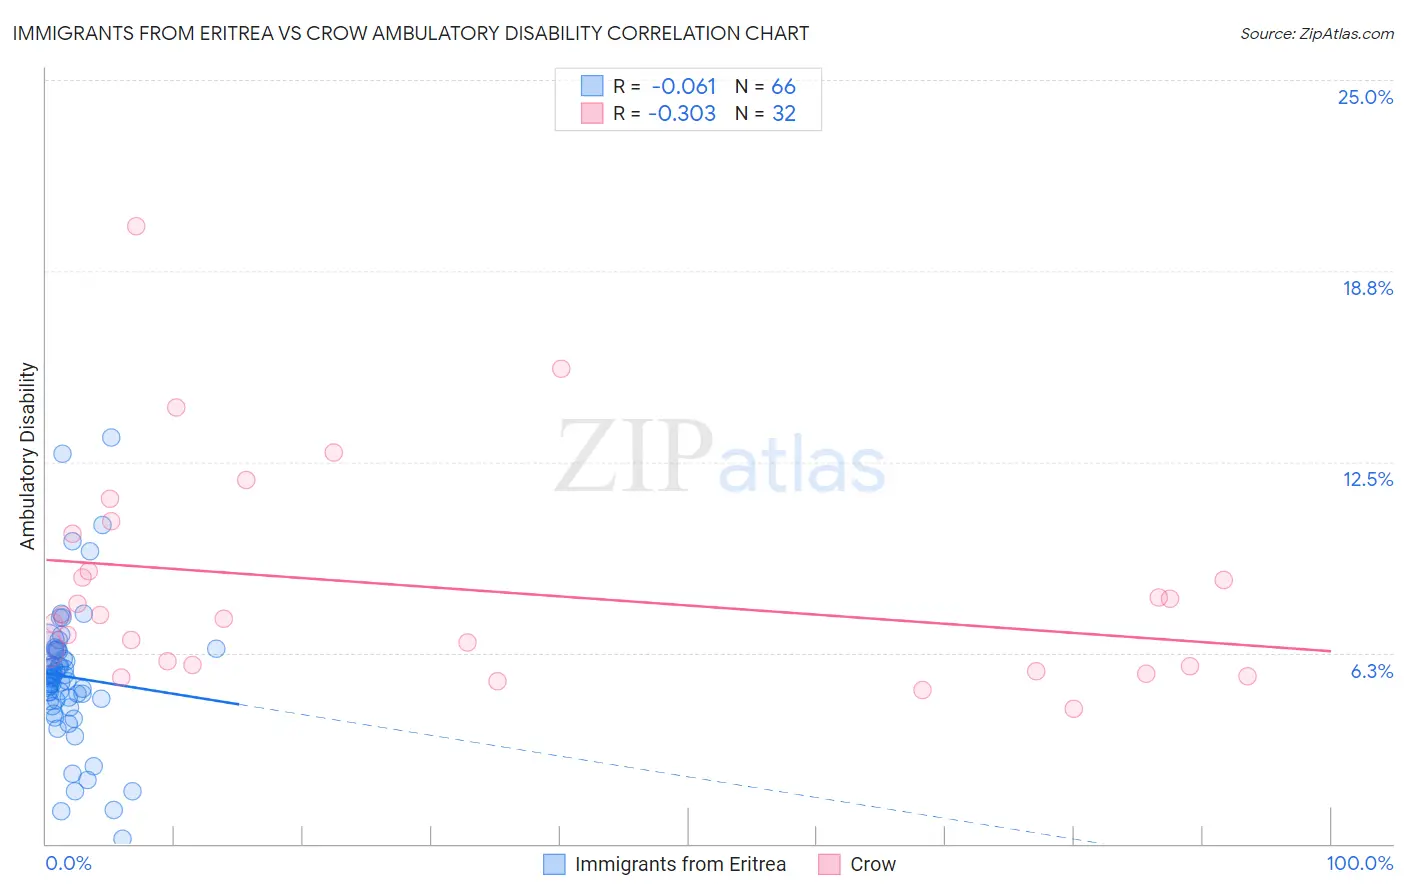
Immigrants from Eritrea vs Crow Ambulatory Disability Correlation Chart
The statistical analysis conducted on geographies consisting of 104,852,788 people shows a slight negative correlation between the proportion of Immigrants from Eritrea and percentage of population with ambulatory disability in the United States with a correlation coefficient (R) of -0.061 and weighted average of 5.5%. Similarly, the statistical analysis conducted on geographies consisting of 59,204,118 people shows a mild negative correlation between the proportion of Crow and percentage of population with ambulatory disability in the United States with a correlation coefficient (R) of -0.303 and weighted average of 6.9%, a difference of 26.0%.
Ambulatory Disability Correlation Summary
| Measurement | Immigrants from Eritrea | Crow |
| Minimum | 0.17% | 4.4% |
| Maximum | 13.3% | 20.2% |
| Range | 13.1% | 15.8% |
| Mean | 5.5% | 8.4% |
| Median | 5.4% | 7.4% |
| Interquartile 25% (IQ1) | 4.7% | 5.8% |
| Interquartile 75% (IQ3) | 6.3% | 9.5% |
| Interquartile Range (IQR) | 1.6% | 3.7% |
| Standard Deviation (Sample) | 2.3% | 3.5% |
| Standard Deviation (Population) | 2.3% | 3.4% |
Similar Demographics by Ambulatory Disability
Demographics Similar to Immigrants from Eritrea by Ambulatory Disability
In terms of ambulatory disability, the demographic groups most similar to Immigrants from Eritrea are Turkish (5.5%, a difference of 0.090%), Cypriot (5.5%, a difference of 0.090%), Immigrants from Malaysia (5.5%, a difference of 0.11%), Afghan (5.5%, a difference of 0.18%), and Immigrants from Asia (5.5%, a difference of 0.22%).
| Demographics | Rating | Rank | Ambulatory Disability |
| Immigrants | Australia | 100.0 /100 | #32 | Exceptional 5.5% |
| Immigrants | Pakistan | 100.0 /100 | #33 | Exceptional 5.5% |
| Immigrants | Asia | 100.0 /100 | #34 | Exceptional 5.5% |
| Afghans | 100.0 /100 | #35 | Exceptional 5.5% |
| Immigrants | Malaysia | 100.0 /100 | #36 | Exceptional 5.5% |
| Turks | 100.0 /100 | #37 | Exceptional 5.5% |
| Cypriots | 100.0 /100 | #38 | Exceptional 5.5% |
| Immigrants | Eritrea | 100.0 /100 | #39 | Exceptional 5.5% |
| Venezuelans | 99.9 /100 | #40 | Exceptional 5.5% |
| Mongolians | 99.9 /100 | #41 | Exceptional 5.5% |
| Argentineans | 99.9 /100 | #42 | Exceptional 5.5% |
| Paraguayans | 99.9 /100 | #43 | Exceptional 5.5% |
| Immigrants | Indonesia | 99.9 /100 | #44 | Exceptional 5.5% |
| Immigrants | Sweden | 99.9 /100 | #45 | Exceptional 5.6% |
| Egyptians | 99.9 /100 | #46 | Exceptional 5.6% |
Demographics Similar to Crow by Ambulatory Disability
In terms of ambulatory disability, the demographic groups most similar to Crow are Cape Verdean (6.9%, a difference of 0.070%), Alaskan Athabascan (6.9%, a difference of 0.23%), Immigrants from St. Vincent and the Grenadines (6.9%, a difference of 0.26%), French American Indian (6.9%, a difference of 0.40%), and Immigrants from Grenada (6.9%, a difference of 0.41%).
| Demographics | Rating | Rank | Ambulatory Disability |
| Immigrants | Nonimmigrants | 0.0 /100 | #288 | Tragic 6.9% |
| Immigrants | Dominica | 0.0 /100 | #289 | Tragic 6.9% |
| Scotch-Irish | 0.0 /100 | #290 | Tragic 6.9% |
| West Indians | 0.0 /100 | #291 | Tragic 6.9% |
| Cheyenne | 0.0 /100 | #292 | Tragic 6.9% |
| Immigrants | St. Vincent and the Grenadines | 0.0 /100 | #293 | Tragic 6.9% |
| Cape Verdeans | 0.0 /100 | #294 | Tragic 6.9% |
| Crow | 0.0 /100 | #295 | Tragic 6.9% |
| Alaskan Athabascans | 0.0 /100 | #296 | Tragic 6.9% |
| French American Indians | 0.0 /100 | #297 | Tragic 6.9% |
| Immigrants | Grenada | 0.0 /100 | #298 | Tragic 6.9% |
| Puget Sound Salish | 0.0 /100 | #299 | Tragic 6.9% |
| Marshallese | 0.0 /100 | #300 | Tragic 6.9% |
| British West Indians | 0.0 /100 | #301 | Tragic 7.0% |
| Immigrants | Armenia | 0.0 /100 | #302 | Tragic 7.0% |