Central American vs Comanche Ambulatory Disability
COMPARE
Central American
Comanche
Ambulatory Disability
Ambulatory Disability Comparison
Central Americans
Comanche
6.0%
AMBULATORY DISABILITY
69.8/ 100
METRIC RATING
160th/ 347
METRIC RANK
7.5%
AMBULATORY DISABILITY
0.0/ 100
METRIC RATING
325th/ 347
METRIC RANK
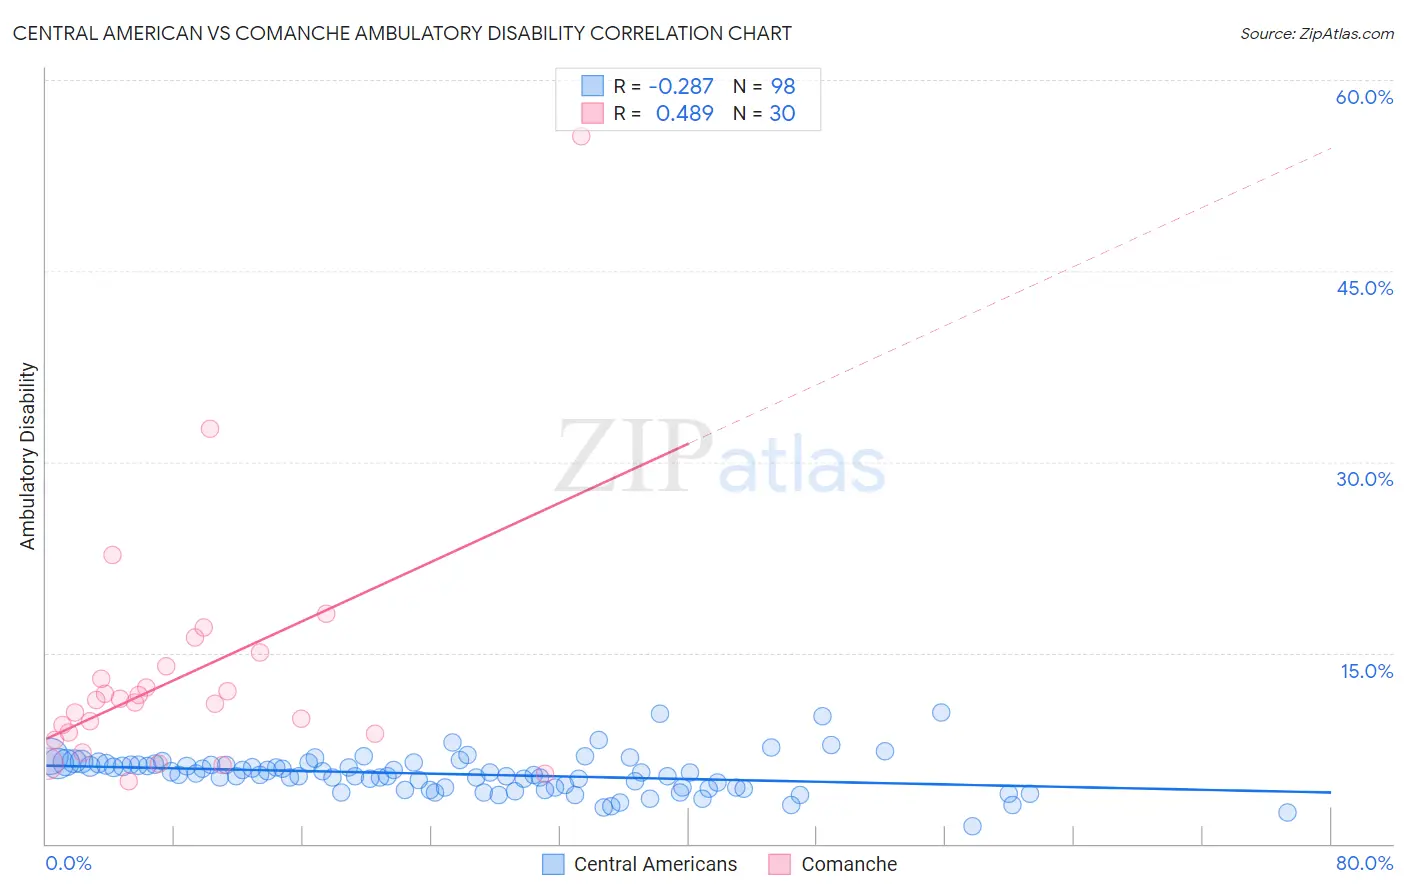
Central American vs Comanche Ambulatory Disability Correlation Chart
The statistical analysis conducted on geographies consisting of 504,305,341 people shows a weak negative correlation between the proportion of Central Americans and percentage of population with ambulatory disability in the United States with a correlation coefficient (R) of -0.287 and weighted average of 6.0%. Similarly, the statistical analysis conducted on geographies consisting of 109,774,668 people shows a moderate positive correlation between the proportion of Comanche and percentage of population with ambulatory disability in the United States with a correlation coefficient (R) of 0.489 and weighted average of 7.5%, a difference of 24.2%.
Ambulatory Disability Correlation Summary
| Measurement | Central American | Comanche |
| Minimum | 1.3% | 4.9% |
| Maximum | 10.3% | 55.6% |
| Range | 9.0% | 50.6% |
| Mean | 5.5% | 13.3% |
| Median | 5.4% | 11.2% |
| Interquartile 25% (IQ1) | 4.4% | 8.6% |
| Interquartile 75% (IQ3) | 6.2% | 13.9% |
| Interquartile Range (IQR) | 1.9% | 5.3% |
| Standard Deviation (Sample) | 1.5% | 9.7% |
| Standard Deviation (Population) | 1.5% | 9.6% |
Similar Demographics by Ambulatory Disability
Demographics Similar to Central Americans by Ambulatory Disability
In terms of ambulatory disability, the demographic groups most similar to Central Americans are Immigrants from Belarus (6.1%, a difference of 0.040%), Immigrants from Fiji (6.0%, a difference of 0.080%), Immigrants from Latvia (6.0%, a difference of 0.080%), Ghanaian (6.0%, a difference of 0.10%), and Northern European (6.0%, a difference of 0.13%).
| Demographics | Rating | Rank | Ambulatory Disability |
| Syrians | 75.5 /100 | #153 | Good 6.0% |
| Immigrants | Croatia | 75.1 /100 | #154 | Good 6.0% |
| Immigrants | Scotland | 72.1 /100 | #155 | Good 6.0% |
| Northern Europeans | 71.8 /100 | #156 | Good 6.0% |
| Ghanaians | 71.3 /100 | #157 | Good 6.0% |
| Immigrants | Fiji | 71.2 /100 | #158 | Good 6.0% |
| Immigrants | Latvia | 71.1 /100 | #159 | Good 6.0% |
| Central Americans | 69.8 /100 | #160 | Good 6.0% |
| Immigrants | Belarus | 69.2 /100 | #161 | Good 6.1% |
| Nigerians | 67.1 /100 | #162 | Good 6.1% |
| Lebanese | 66.2 /100 | #163 | Good 6.1% |
| Basques | 63.7 /100 | #164 | Good 6.1% |
| Nicaraguans | 63.2 /100 | #165 | Good 6.1% |
| Iraqis | 62.8 /100 | #166 | Good 6.1% |
| Immigrants | Oceania | 60.7 /100 | #167 | Good 6.1% |
Demographics Similar to Comanche by Ambulatory Disability
In terms of ambulatory disability, the demographic groups most similar to Comanche are Navajo (7.5%, a difference of 0.070%), Black/African American (7.5%, a difference of 0.11%), Native/Alaskan (7.5%, a difference of 0.12%), Hopi (7.6%, a difference of 1.1%), and Pueblo (7.6%, a difference of 1.1%).
| Demographics | Rating | Rank | Ambulatory Disability |
| Ottawa | 0.0 /100 | #318 | Tragic 7.2% |
| Dominicans | 0.0 /100 | #319 | Tragic 7.2% |
| Potawatomi | 0.0 /100 | #320 | Tragic 7.3% |
| Apache | 0.0 /100 | #321 | Tragic 7.4% |
| Osage | 0.0 /100 | #322 | Tragic 7.4% |
| Americans | 0.0 /100 | #323 | Tragic 7.4% |
| Navajo | 0.0 /100 | #324 | Tragic 7.5% |
| Comanche | 0.0 /100 | #325 | Tragic 7.5% |
| Blacks/African Americans | 0.0 /100 | #326 | Tragic 7.5% |
| Natives/Alaskans | 0.0 /100 | #327 | Tragic 7.5% |
| Hopi | 0.0 /100 | #328 | Tragic 7.6% |
| Pueblo | 0.0 /100 | #329 | Tragic 7.6% |
| Paiute | 0.0 /100 | #330 | Tragic 7.7% |
| Cajuns | 0.0 /100 | #331 | Tragic 7.8% |
| Menominee | 0.0 /100 | #332 | Tragic 7.8% |