Armenian vs Comanche Ambulatory Disability
COMPARE
Armenian
Comanche
Ambulatory Disability
Ambulatory Disability Comparison
Armenians
Comanche
6.5%
AMBULATORY DISABILITY
1.5/ 100
METRIC RATING
246th/ 347
METRIC RANK
7.5%
AMBULATORY DISABILITY
0.0/ 100
METRIC RATING
325th/ 347
METRIC RANK
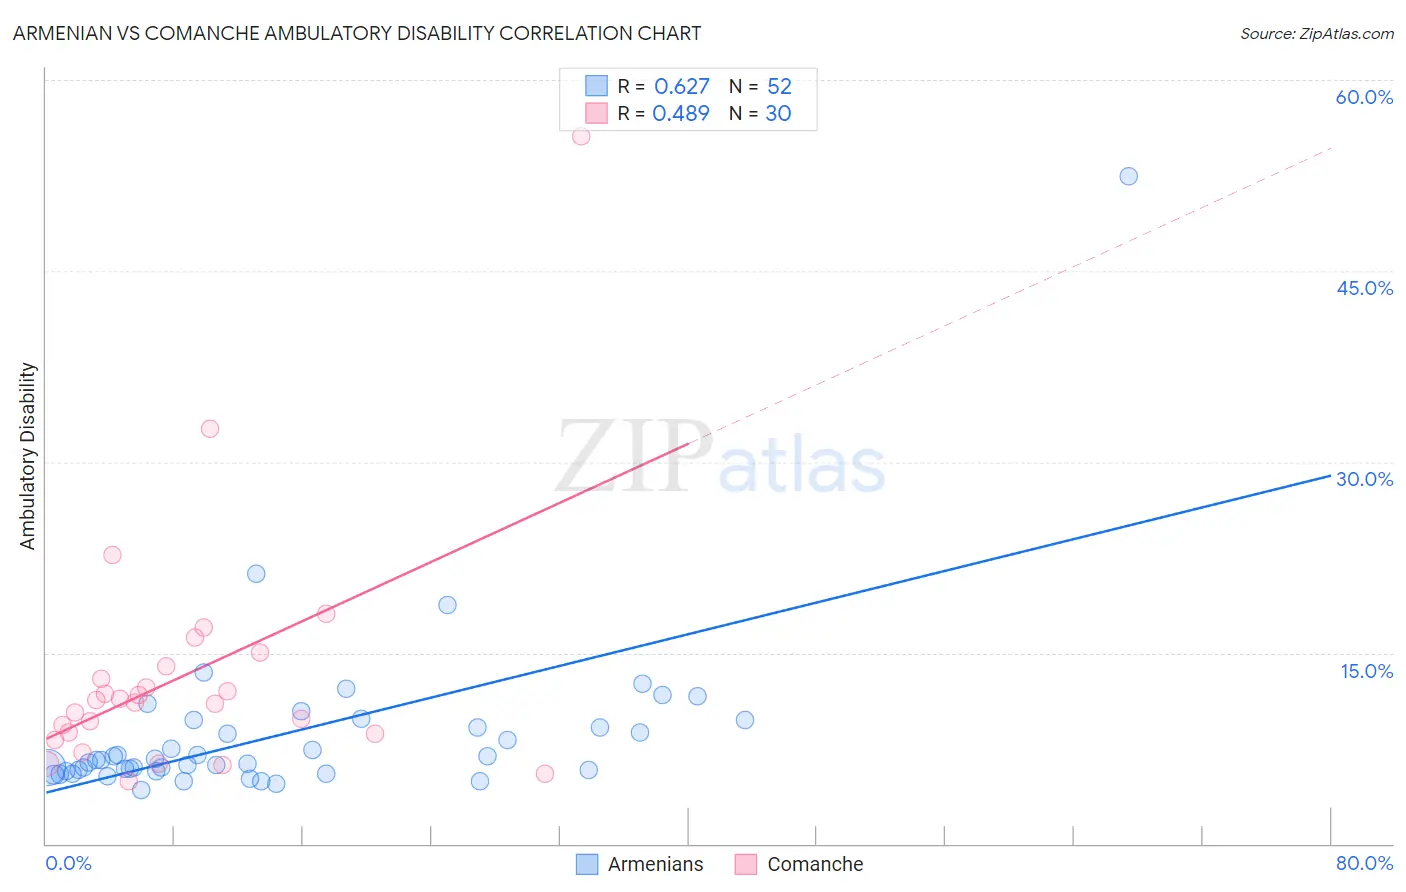
Armenian vs Comanche Ambulatory Disability Correlation Chart
The statistical analysis conducted on geographies consisting of 310,863,857 people shows a significant positive correlation between the proportion of Armenians and percentage of population with ambulatory disability in the United States with a correlation coefficient (R) of 0.627 and weighted average of 6.5%. Similarly, the statistical analysis conducted on geographies consisting of 109,774,668 people shows a moderate positive correlation between the proportion of Comanche and percentage of population with ambulatory disability in the United States with a correlation coefficient (R) of 0.489 and weighted average of 7.5%, a difference of 16.3%.
Ambulatory Disability Correlation Summary
| Measurement | Armenian | Comanche |
| Minimum | 4.2% | 4.9% |
| Maximum | 52.5% | 55.6% |
| Range | 48.3% | 50.6% |
| Mean | 8.7% | 13.3% |
| Median | 6.6% | 11.2% |
| Interquartile 25% (IQ1) | 5.7% | 8.6% |
| Interquartile 75% (IQ3) | 9.4% | 13.9% |
| Interquartile Range (IQR) | 3.7% | 5.3% |
| Standard Deviation (Sample) | 7.0% | 9.7% |
| Standard Deviation (Population) | 7.0% | 9.6% |
Similar Demographics by Ambulatory Disability
Demographics Similar to Armenians by Ambulatory Disability
In terms of ambulatory disability, the demographic groups most similar to Armenians are Tlingit-Haida (6.5%, a difference of 0.020%), German (6.5%, a difference of 0.050%), Immigrants from Panama (6.5%, a difference of 0.050%), Immigrants from Cuba (6.5%, a difference of 0.050%), and Spaniard (6.5%, a difference of 0.070%).
| Demographics | Rating | Rank | Ambulatory Disability |
| Senegalese | 1.7 /100 | #239 | Tragic 6.4% |
| Immigrants | Senegal | 1.7 /100 | #240 | Tragic 6.4% |
| Immigrants | Haiti | 1.6 /100 | #241 | Tragic 6.5% |
| Spaniards | 1.6 /100 | #242 | Tragic 6.5% |
| Germans | 1.5 /100 | #243 | Tragic 6.5% |
| Immigrants | Panama | 1.5 /100 | #244 | Tragic 6.5% |
| Tlingit-Haida | 1.5 /100 | #245 | Tragic 6.5% |
| Armenians | 1.5 /100 | #246 | Tragic 6.5% |
| Immigrants | Cuba | 1.4 /100 | #247 | Tragic 6.5% |
| Immigrants | Portugal | 1.4 /100 | #248 | Tragic 6.5% |
| Native Hawaiians | 1.1 /100 | #249 | Tragic 6.5% |
| Chinese | 1.0 /100 | #250 | Tragic 6.5% |
| Hawaiians | 0.9 /100 | #251 | Tragic 6.5% |
| Immigrants | Bahamas | 0.8 /100 | #252 | Tragic 6.5% |
| Scottish | 0.7 /100 | #253 | Tragic 6.5% |
Demographics Similar to Comanche by Ambulatory Disability
In terms of ambulatory disability, the demographic groups most similar to Comanche are Navajo (7.5%, a difference of 0.070%), Black/African American (7.5%, a difference of 0.11%), Native/Alaskan (7.5%, a difference of 0.12%), Hopi (7.6%, a difference of 1.1%), and Pueblo (7.6%, a difference of 1.1%).
| Demographics | Rating | Rank | Ambulatory Disability |
| Ottawa | 0.0 /100 | #318 | Tragic 7.2% |
| Dominicans | 0.0 /100 | #319 | Tragic 7.2% |
| Potawatomi | 0.0 /100 | #320 | Tragic 7.3% |
| Apache | 0.0 /100 | #321 | Tragic 7.4% |
| Osage | 0.0 /100 | #322 | Tragic 7.4% |
| Americans | 0.0 /100 | #323 | Tragic 7.4% |
| Navajo | 0.0 /100 | #324 | Tragic 7.5% |
| Comanche | 0.0 /100 | #325 | Tragic 7.5% |
| Blacks/African Americans | 0.0 /100 | #326 | Tragic 7.5% |
| Natives/Alaskans | 0.0 /100 | #327 | Tragic 7.5% |
| Hopi | 0.0 /100 | #328 | Tragic 7.6% |
| Pueblo | 0.0 /100 | #329 | Tragic 7.6% |
| Paiute | 0.0 /100 | #330 | Tragic 7.7% |
| Cajuns | 0.0 /100 | #331 | Tragic 7.8% |
| Menominee | 0.0 /100 | #332 | Tragic 7.8% |