Taiwanese vs Immigrants from Colombia Associate's Degree
COMPARE
Taiwanese
Immigrants from Colombia
Associate's Degree
Associate's Degree Comparison
Taiwanese
Immigrants from Colombia
47.7%
ASSOCIATE'S DEGREE
83.3/ 100
METRIC RATING
141st/ 347
METRIC RANK
46.0%
ASSOCIATE'S DEGREE
41.3/ 100
METRIC RATING
181st/ 347
METRIC RANK
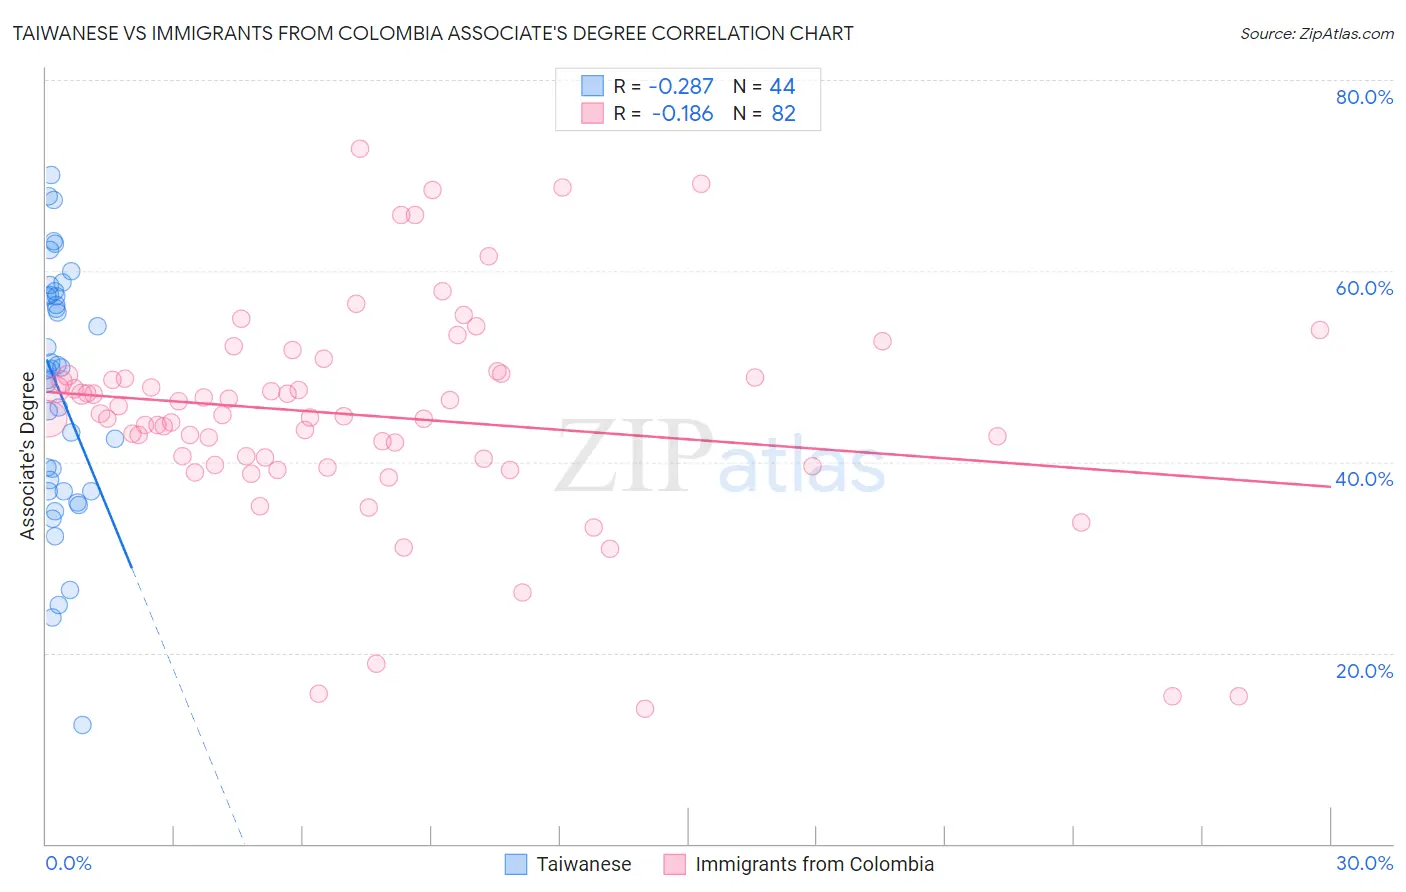
Taiwanese vs Immigrants from Colombia Associate's Degree Correlation Chart
The statistical analysis conducted on geographies consisting of 31,724,936 people shows a weak negative correlation between the proportion of Taiwanese and percentage of population with at least associate's degree education in the United States with a correlation coefficient (R) of -0.287 and weighted average of 47.7%. Similarly, the statistical analysis conducted on geographies consisting of 378,676,952 people shows a poor negative correlation between the proportion of Immigrants from Colombia and percentage of population with at least associate's degree education in the United States with a correlation coefficient (R) of -0.186 and weighted average of 46.0%, a difference of 3.7%.
Associate's Degree Correlation Summary
| Measurement | Taiwanese | Immigrants from Colombia |
| Minimum | 12.5% | 14.1% |
| Maximum | 70.0% | 72.8% |
| Range | 57.5% | 58.7% |
| Mean | 47.4% | 44.8% |
| Median | 49.7% | 44.8% |
| Interquartile 25% (IQ1) | 36.9% | 40.3% |
| Interquartile 75% (IQ3) | 57.5% | 49.1% |
| Interquartile Range (IQR) | 20.5% | 8.8% |
| Standard Deviation (Sample) | 13.1% | 11.4% |
| Standard Deviation (Population) | 12.9% | 11.3% |
Similar Demographics by Associate's Degree
Demographics Similar to Taiwanese by Associate's Degree
In terms of associate's degree, the demographic groups most similar to Taiwanese are Sierra Leonean (47.7%, a difference of 0.050%), Immigrants from Southern Europe (47.8%, a difference of 0.15%), Slovene (47.9%, a difference of 0.24%), Norwegian (47.6%, a difference of 0.28%), and Slavic (47.6%, a difference of 0.34%).
| Demographics | Rating | Rank | Associate's Degree |
| Moroccans | 89.3 /100 | #134 | Excellent 48.2% |
| Europeans | 89.0 /100 | #135 | Excellent 48.2% |
| Pakistanis | 88.0 /100 | #136 | Excellent 48.1% |
| Immigrants | Eritrea | 87.8 /100 | #137 | Excellent 48.1% |
| Poles | 87.3 /100 | #138 | Excellent 48.0% |
| Slovenes | 85.1 /100 | #139 | Excellent 47.9% |
| Immigrants | Southern Europe | 84.4 /100 | #140 | Excellent 47.8% |
| Taiwanese | 83.3 /100 | #141 | Excellent 47.7% |
| Sierra Leoneans | 82.9 /100 | #142 | Excellent 47.7% |
| Norwegians | 81.0 /100 | #143 | Excellent 47.6% |
| Slavs | 80.5 /100 | #144 | Excellent 47.6% |
| Canadians | 79.0 /100 | #145 | Good 47.5% |
| Immigrants | Sudan | 77.9 /100 | #146 | Good 47.4% |
| Danes | 77.3 /100 | #147 | Good 47.4% |
| South American Indians | 76.7 /100 | #148 | Good 47.4% |
Demographics Similar to Immigrants from Colombia by Associate's Degree
In terms of associate's degree, the demographic groups most similar to Immigrants from Colombia are Swiss (46.0%, a difference of 0.070%), Yugoslavian (46.0%, a difference of 0.080%), Czechoslovakian (46.0%, a difference of 0.10%), Costa Rican (46.0%, a difference of 0.21%), and Welsh (45.9%, a difference of 0.27%).
| Demographics | Rating | Rank | Associate's Degree |
| English | 50.0 /100 | #174 | Average 46.4% |
| Belgians | 48.9 /100 | #175 | Average 46.3% |
| Finns | 48.5 /100 | #176 | Average 46.3% |
| Slovaks | 48.4 /100 | #177 | Average 46.3% |
| Immigrants | Bosnia and Herzegovina | 48.3 /100 | #178 | Average 46.3% |
| Sri Lankans | 47.6 /100 | #179 | Average 46.3% |
| Bermudans | 46.4 /100 | #180 | Average 46.2% |
| Immigrants | Colombia | 41.3 /100 | #181 | Average 46.0% |
| Swiss | 40.4 /100 | #182 | Average 46.0% |
| Yugoslavians | 40.2 /100 | #183 | Average 46.0% |
| Czechoslovakians | 40.0 /100 | #184 | Average 46.0% |
| Costa Ricans | 38.6 /100 | #185 | Fair 46.0% |
| Welsh | 37.9 /100 | #186 | Fair 45.9% |
| Immigrants | Uruguay | 35.5 /100 | #187 | Fair 45.8% |
| Ghanaians | 35.5 /100 | #188 | Fair 45.8% |