Immigrants from Asia vs Immigrants from Iran Female Disability
COMPARE
Immigrants from Asia
Immigrants from Iran
Female Disability
Female Disability Comparison
Immigrants from Asia
Immigrants from Iran
11.0%
FEMALE DISABILITY
100.0/ 100
METRIC RATING
25th/ 347
METRIC RANK
10.8%
FEMALE DISABILITY
100.0/ 100
METRIC RATING
18th/ 347
METRIC RANK
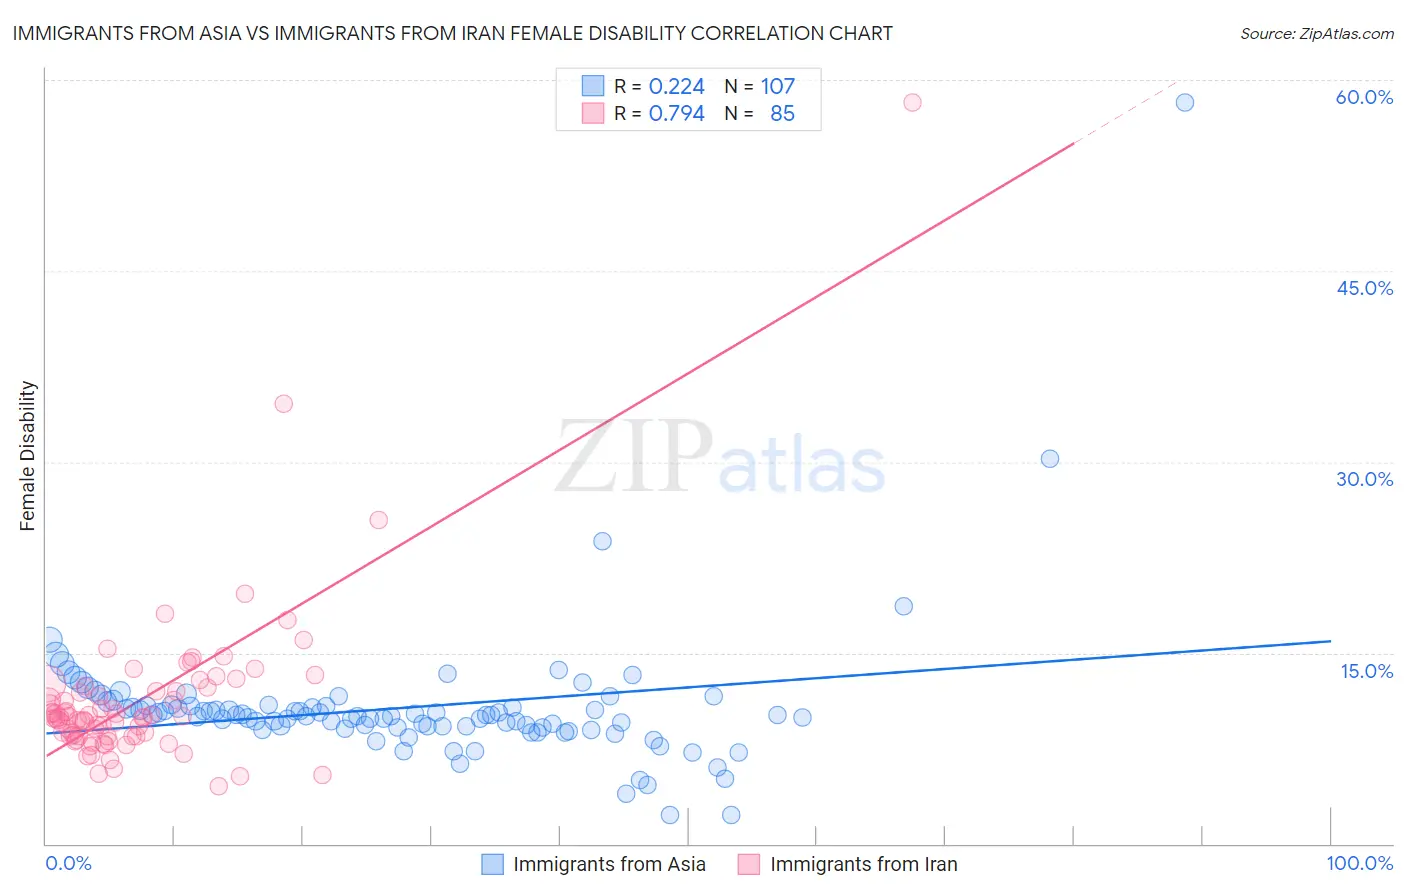
Immigrants from Asia vs Immigrants from Iran Female Disability Correlation Chart
The statistical analysis conducted on geographies consisting of 548,970,010 people shows a weak positive correlation between the proportion of Immigrants from Asia and percentage of females with a disability in the United States with a correlation coefficient (R) of 0.224 and weighted average of 11.0%. Similarly, the statistical analysis conducted on geographies consisting of 279,884,220 people shows a strong positive correlation between the proportion of Immigrants from Iran and percentage of females with a disability in the United States with a correlation coefficient (R) of 0.794 and weighted average of 10.8%, a difference of 1.7%.
Female Disability Correlation Summary
| Measurement | Immigrants from Asia | Immigrants from Iran |
| Minimum | 2.2% | 4.5% |
| Maximum | 58.2% | 58.2% |
| Range | 56.0% | 53.8% |
| Mean | 10.7% | 11.3% |
| Median | 10.1% | 9.9% |
| Interquartile 25% (IQ1) | 9.2% | 8.5% |
| Interquartile 75% (IQ3) | 10.8% | 12.1% |
| Interquartile Range (IQR) | 1.7% | 3.6% |
| Standard Deviation (Sample) | 5.7% | 6.6% |
| Standard Deviation (Population) | 5.7% | 6.6% |
Demographics Similar to Immigrants from Asia and Immigrants from Iran by Female Disability
In terms of female disability, the demographic groups most similar to Immigrants from Asia are Immigrants from Argentina (11.0%, a difference of 0.030%), Argentinean (11.0%, a difference of 0.040%), Immigrants from Turkey (11.1%, a difference of 0.44%), Venezuelan (11.0%, a difference of 0.59%), and Egyptian (11.1%, a difference of 0.72%). Similarly, the demographic groups most similar to Immigrants from Iran are Immigrants from Venezuela (10.9%, a difference of 0.21%), Indian (Asian) (10.8%, a difference of 0.38%), Immigrants from Pakistan (10.9%, a difference of 0.39%), Okinawan (10.8%, a difference of 0.70%), and Asian (10.9%, a difference of 0.75%).
| Demographics | Rating | Rank | Female Disability |
| Immigrants | Korea | 100.0 /100 | #11 | Exceptional 10.6% |
| Immigrants | Israel | 100.0 /100 | #12 | Exceptional 10.7% |
| Immigrants | Eastern Asia | 100.0 /100 | #13 | Exceptional 10.7% |
| Immigrants | China | 100.0 /100 | #14 | Exceptional 10.7% |
| Burmese | 100.0 /100 | #15 | Exceptional 10.7% |
| Okinawans | 100.0 /100 | #16 | Exceptional 10.8% |
| Indians (Asian) | 100.0 /100 | #17 | Exceptional 10.8% |
| Immigrants | Iran | 100.0 /100 | #18 | Exceptional 10.8% |
| Immigrants | Venezuela | 100.0 /100 | #19 | Exceptional 10.9% |
| Immigrants | Pakistan | 100.0 /100 | #20 | Exceptional 10.9% |
| Asians | 100.0 /100 | #21 | Exceptional 10.9% |
| Immigrants | Sri Lanka | 100.0 /100 | #22 | Exceptional 10.9% |
| Venezuelans | 100.0 /100 | #23 | Exceptional 11.0% |
| Immigrants | Argentina | 100.0 /100 | #24 | Exceptional 11.0% |
| Immigrants | Asia | 100.0 /100 | #25 | Exceptional 11.0% |
| Argentineans | 100.0 /100 | #26 | Exceptional 11.0% |
| Immigrants | Turkey | 100.0 /100 | #27 | Exceptional 11.1% |
| Egyptians | 100.0 /100 | #28 | Exceptional 11.1% |
| Immigrants | Malaysia | 100.0 /100 | #29 | Exceptional 11.1% |
| Turks | 100.0 /100 | #30 | Exceptional 11.1% |
| Immigrants | Kuwait | 100.0 /100 | #31 | Exceptional 11.1% |