Syrian vs Immigrants from Israel Hearing Disability
COMPARE
Syrian
Immigrants from Israel
Hearing Disability
Hearing Disability Comparison
Syrians
Immigrants from Israel
3.1%
HEARING DISABILITY
19.2/ 100
METRIC RATING
199th/ 347
METRIC RANK
2.6%
HEARING DISABILITY
99.3/ 100
METRIC RATING
47th/ 347
METRIC RANK
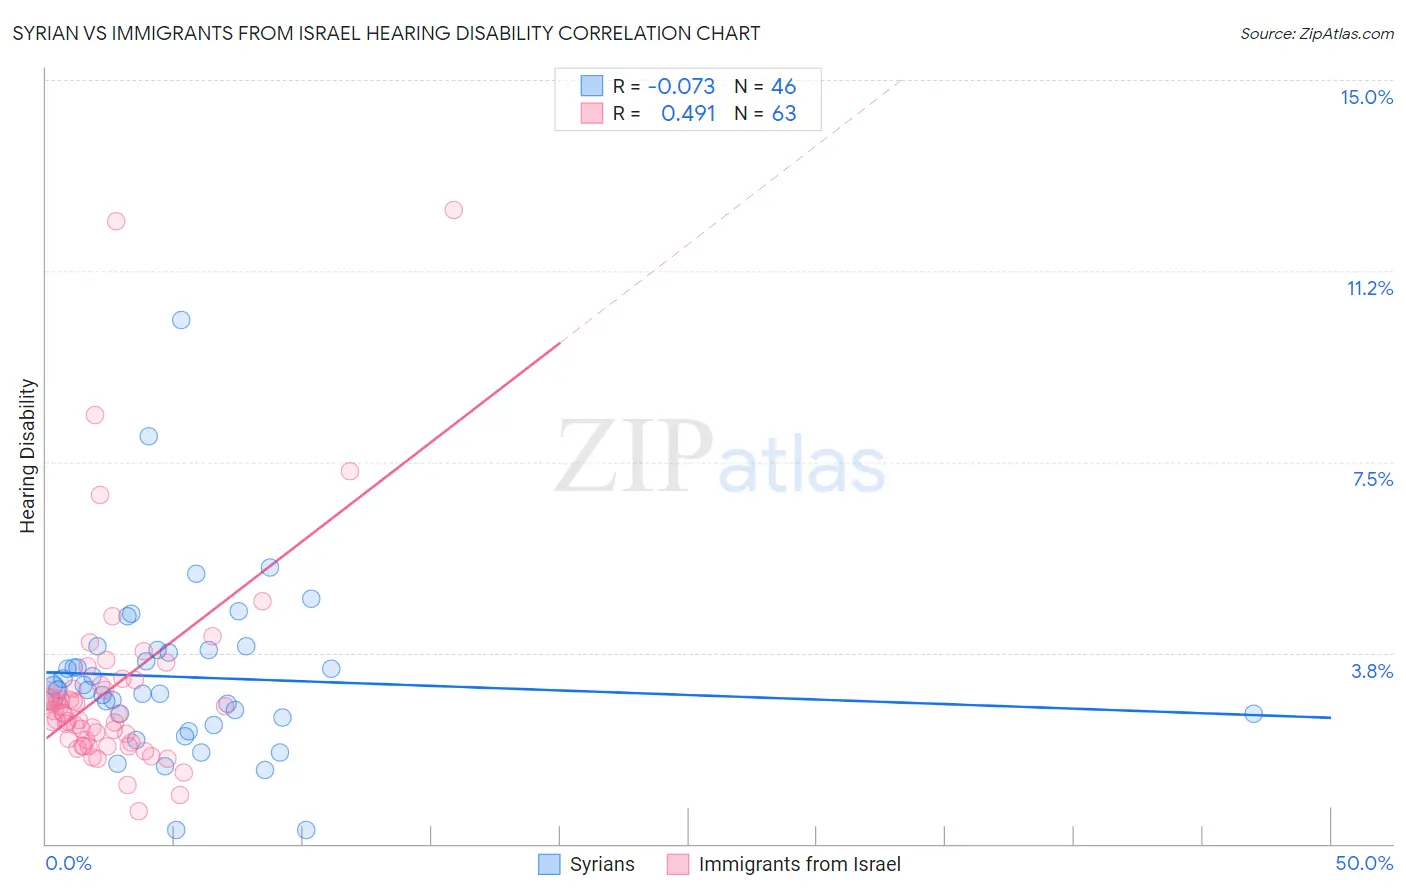
Syrian vs Immigrants from Israel Hearing Disability Correlation Chart
The statistical analysis conducted on geographies consisting of 266,258,902 people shows a slight negative correlation between the proportion of Syrians and percentage of population with hearing disability in the United States with a correlation coefficient (R) of -0.073 and weighted average of 3.1%. Similarly, the statistical analysis conducted on geographies consisting of 210,020,073 people shows a moderate positive correlation between the proportion of Immigrants from Israel and percentage of population with hearing disability in the United States with a correlation coefficient (R) of 0.491 and weighted average of 2.6%, a difference of 16.9%.
Hearing Disability Correlation Summary
| Measurement | Syrian | Immigrants from Israel |
| Minimum | 0.27% | 0.64% |
| Maximum | 10.3% | 12.4% |
| Range | 10.0% | 11.8% |
| Mean | 3.3% | 3.1% |
| Median | 3.0% | 2.5% |
| Interquartile 25% (IQ1) | 2.5% | 2.0% |
| Interquartile 75% (IQ3) | 3.8% | 3.1% |
| Interquartile Range (IQR) | 1.3% | 1.1% |
| Standard Deviation (Sample) | 1.7% | 2.1% |
| Standard Deviation (Population) | 1.7% | 2.1% |
Similar Demographics by Hearing Disability
Demographics Similar to Syrians by Hearing Disability
In terms of hearing disability, the demographic groups most similar to Syrians are Immigrants from North Macedonia (3.1%, a difference of 0.010%), Iraqi (3.1%, a difference of 0.030%), Immigrants from Croatia (3.1%, a difference of 0.18%), Immigrants from Bosnia and Herzegovina (3.1%, a difference of 0.20%), and Immigrants from Thailand (3.1%, a difference of 0.43%).
| Demographics | Rating | Rank | Hearing Disability |
| Koreans | 27.6 /100 | #192 | Fair 3.1% |
| Macedonians | 27.0 /100 | #193 | Fair 3.1% |
| South Africans | 24.5 /100 | #194 | Fair 3.1% |
| Spanish American Indians | 24.1 /100 | #195 | Fair 3.1% |
| Immigrants | Europe | 22.9 /100 | #196 | Fair 3.1% |
| Immigrants | Bosnia and Herzegovina | 20.6 /100 | #197 | Fair 3.1% |
| Immigrants | Croatia | 20.5 /100 | #198 | Fair 3.1% |
| Syrians | 19.2 /100 | #199 | Poor 3.1% |
| Immigrants | North Macedonia | 19.1 /100 | #200 | Poor 3.1% |
| Iraqis | 19.0 /100 | #201 | Poor 3.1% |
| Immigrants | Thailand | 16.4 /100 | #202 | Poor 3.1% |
| Immigrants | Denmark | 16.2 /100 | #203 | Poor 3.1% |
| Immigrants | Czechoslovakia | 15.9 /100 | #204 | Poor 3.1% |
| Alsatians | 15.9 /100 | #205 | Poor 3.1% |
| Eastern Europeans | 15.5 /100 | #206 | Poor 3.1% |
Demographics Similar to Immigrants from Israel by Hearing Disability
In terms of hearing disability, the demographic groups most similar to Immigrants from Israel are Immigrants from Singapore (2.6%, a difference of 0.070%), Immigrants from Dominica (2.6%, a difference of 0.15%), Immigrants from South America (2.7%, a difference of 0.19%), Venezuelan (2.6%, a difference of 0.25%), and Nigerian (2.6%, a difference of 0.28%).
| Demographics | Rating | Rank | Hearing Disability |
| Haitians | 99.5 /100 | #40 | Exceptional 2.6% |
| Immigrants | Taiwan | 99.4 /100 | #41 | Exceptional 2.6% |
| West Indians | 99.4 /100 | #42 | Exceptional 2.6% |
| Senegalese | 99.4 /100 | #43 | Exceptional 2.6% |
| Nigerians | 99.4 /100 | #44 | Exceptional 2.6% |
| Venezuelans | 99.4 /100 | #45 | Exceptional 2.6% |
| Immigrants | Dominica | 99.3 /100 | #46 | Exceptional 2.6% |
| Immigrants | Israel | 99.3 /100 | #47 | Exceptional 2.6% |
| Immigrants | Singapore | 99.3 /100 | #48 | Exceptional 2.6% |
| Immigrants | South America | 99.2 /100 | #49 | Exceptional 2.7% |
| Paraguayans | 99.2 /100 | #50 | Exceptional 2.7% |
| Immigrants | Hong Kong | 99.2 /100 | #51 | Exceptional 2.7% |
| Jamaicans | 99.0 /100 | #52 | Exceptional 2.7% |
| Immigrants | Eastern Asia | 99.0 /100 | #53 | Exceptional 2.7% |
| Ethiopians | 99.0 /100 | #54 | Exceptional 2.7% |