Syrian vs Immigrants from Panama Hearing Disability
COMPARE
Syrian
Immigrants from Panama
Hearing Disability
Hearing Disability Comparison
Syrians
Immigrants from Panama
3.1%
HEARING DISABILITY
19.2/ 100
METRIC RATING
199th/ 347
METRIC RANK
2.9%
HEARING DISABILITY
76.9/ 100
METRIC RATING
149th/ 347
METRIC RANK
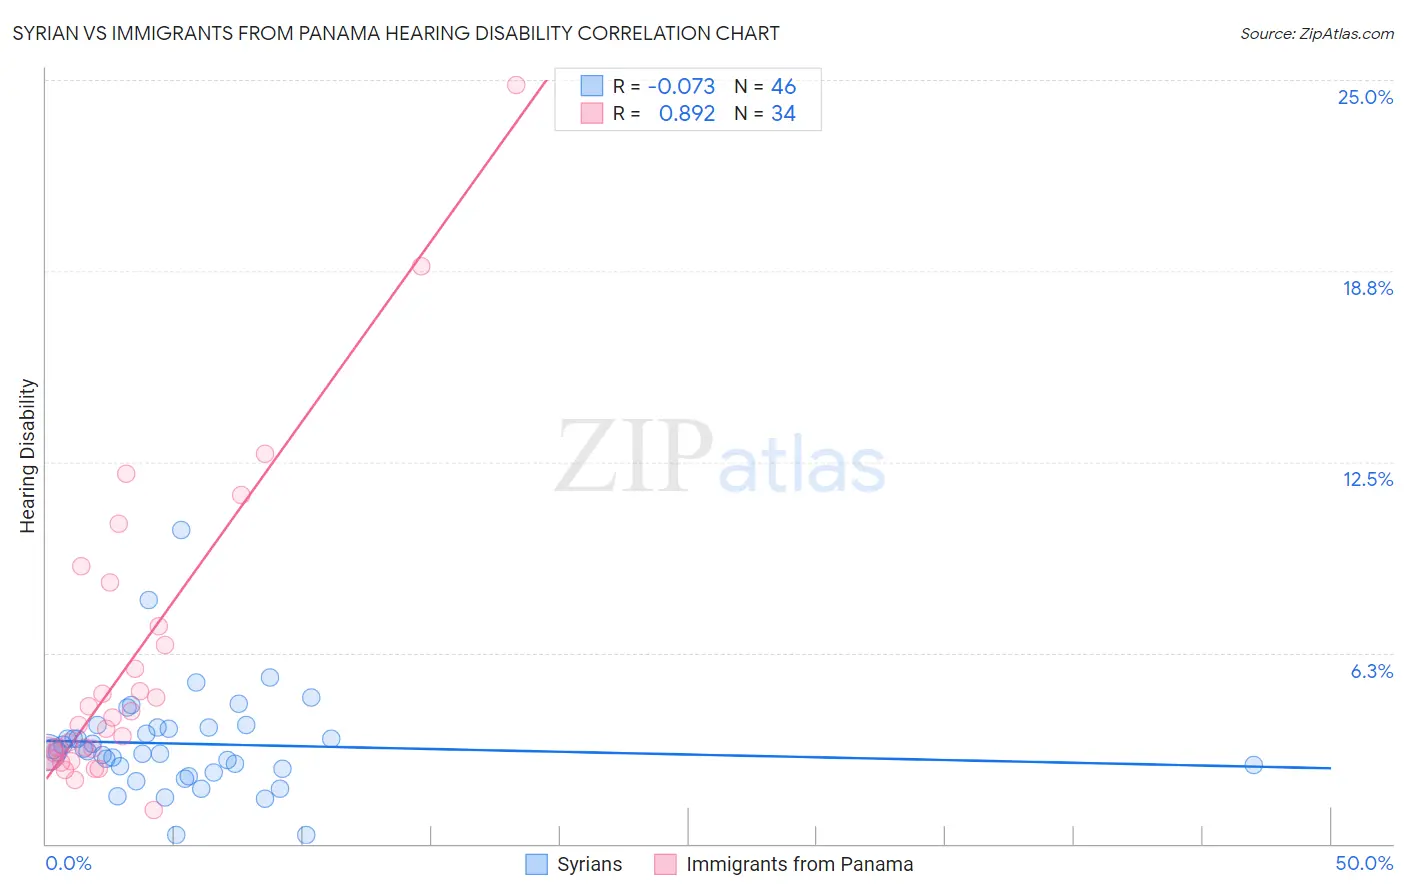
Syrian vs Immigrants from Panama Hearing Disability Correlation Chart
The statistical analysis conducted on geographies consisting of 266,258,902 people shows a slight negative correlation between the proportion of Syrians and percentage of population with hearing disability in the United States with a correlation coefficient (R) of -0.073 and weighted average of 3.1%. Similarly, the statistical analysis conducted on geographies consisting of 221,167,736 people shows a very strong positive correlation between the proportion of Immigrants from Panama and percentage of population with hearing disability in the United States with a correlation coefficient (R) of 0.892 and weighted average of 2.9%, a difference of 6.4%.
Hearing Disability Correlation Summary
| Measurement | Syrian | Immigrants from Panama |
| Minimum | 0.27% | 1.1% |
| Maximum | 10.3% | 24.8% |
| Range | 10.0% | 23.7% |
| Mean | 3.3% | 6.0% |
| Median | 3.0% | 4.0% |
| Interquartile 25% (IQ1) | 2.5% | 3.0% |
| Interquartile 75% (IQ3) | 3.8% | 7.1% |
| Interquartile Range (IQR) | 1.3% | 4.1% |
| Standard Deviation (Sample) | 1.7% | 5.1% |
| Standard Deviation (Population) | 1.7% | 5.0% |
Similar Demographics by Hearing Disability
Demographics Similar to Syrians by Hearing Disability
In terms of hearing disability, the demographic groups most similar to Syrians are Immigrants from North Macedonia (3.1%, a difference of 0.010%), Iraqi (3.1%, a difference of 0.030%), Immigrants from Croatia (3.1%, a difference of 0.18%), Immigrants from Bosnia and Herzegovina (3.1%, a difference of 0.20%), and Immigrants from Thailand (3.1%, a difference of 0.43%).
| Demographics | Rating | Rank | Hearing Disability |
| Koreans | 27.6 /100 | #192 | Fair 3.1% |
| Macedonians | 27.0 /100 | #193 | Fair 3.1% |
| South Africans | 24.5 /100 | #194 | Fair 3.1% |
| Spanish American Indians | 24.1 /100 | #195 | Fair 3.1% |
| Immigrants | Europe | 22.9 /100 | #196 | Fair 3.1% |
| Immigrants | Bosnia and Herzegovina | 20.6 /100 | #197 | Fair 3.1% |
| Immigrants | Croatia | 20.5 /100 | #198 | Fair 3.1% |
| Syrians | 19.2 /100 | #199 | Poor 3.1% |
| Immigrants | North Macedonia | 19.1 /100 | #200 | Poor 3.1% |
| Iraqis | 19.0 /100 | #201 | Poor 3.1% |
| Immigrants | Thailand | 16.4 /100 | #202 | Poor 3.1% |
| Immigrants | Denmark | 16.2 /100 | #203 | Poor 3.1% |
| Immigrants | Czechoslovakia | 15.9 /100 | #204 | Poor 3.1% |
| Alsatians | 15.9 /100 | #205 | Poor 3.1% |
| Eastern Europeans | 15.5 /100 | #206 | Poor 3.1% |
Demographics Similar to Immigrants from Panama by Hearing Disability
In terms of hearing disability, the demographic groups most similar to Immigrants from Panama are Immigrants from Russia (2.9%, a difference of 0.11%), Tongan (2.9%, a difference of 0.25%), Brazilian (2.9%, a difference of 0.26%), Immigrants from Congo (2.9%, a difference of 0.28%), and Immigrants from Bulgaria (2.9%, a difference of 0.33%).
| Demographics | Rating | Rank | Hearing Disability |
| Laotians | 81.1 /100 | #142 | Excellent 2.9% |
| Immigrants | Bahamas | 80.9 /100 | #143 | Excellent 2.9% |
| Immigrants | Bulgaria | 79.2 /100 | #144 | Good 2.9% |
| Immigrants | Congo | 78.9 /100 | #145 | Good 2.9% |
| Brazilians | 78.7 /100 | #146 | Good 2.9% |
| Tongans | 78.6 /100 | #147 | Good 2.9% |
| Immigrants | Russia | 77.7 /100 | #148 | Good 2.9% |
| Immigrants | Panama | 76.9 /100 | #149 | Good 2.9% |
| Palestinians | 73.6 /100 | #150 | Good 2.9% |
| Immigrants | France | 73.1 /100 | #151 | Good 2.9% |
| Immigrants | Lithuania | 73.0 /100 | #152 | Good 2.9% |
| Sudanese | 72.1 /100 | #153 | Good 2.9% |
| Immigrants | Lebanon | 71.5 /100 | #154 | Good 2.9% |
| Costa Ricans | 71.4 /100 | #155 | Good 2.9% |
| Immigrants | Poland | 70.2 /100 | #156 | Good 2.9% |