Swiss vs Greek Female Disability
COMPARE
Swiss
Greek
Female Disability
Female Disability Comparison
Swiss
Greeks
12.4%
FEMALE DISABILITY
14.9/ 100
METRIC RATING
210th/ 347
METRIC RANK
12.0%
FEMALE DISABILITY
82.0/ 100
METRIC RATING
149th/ 347
METRIC RANK
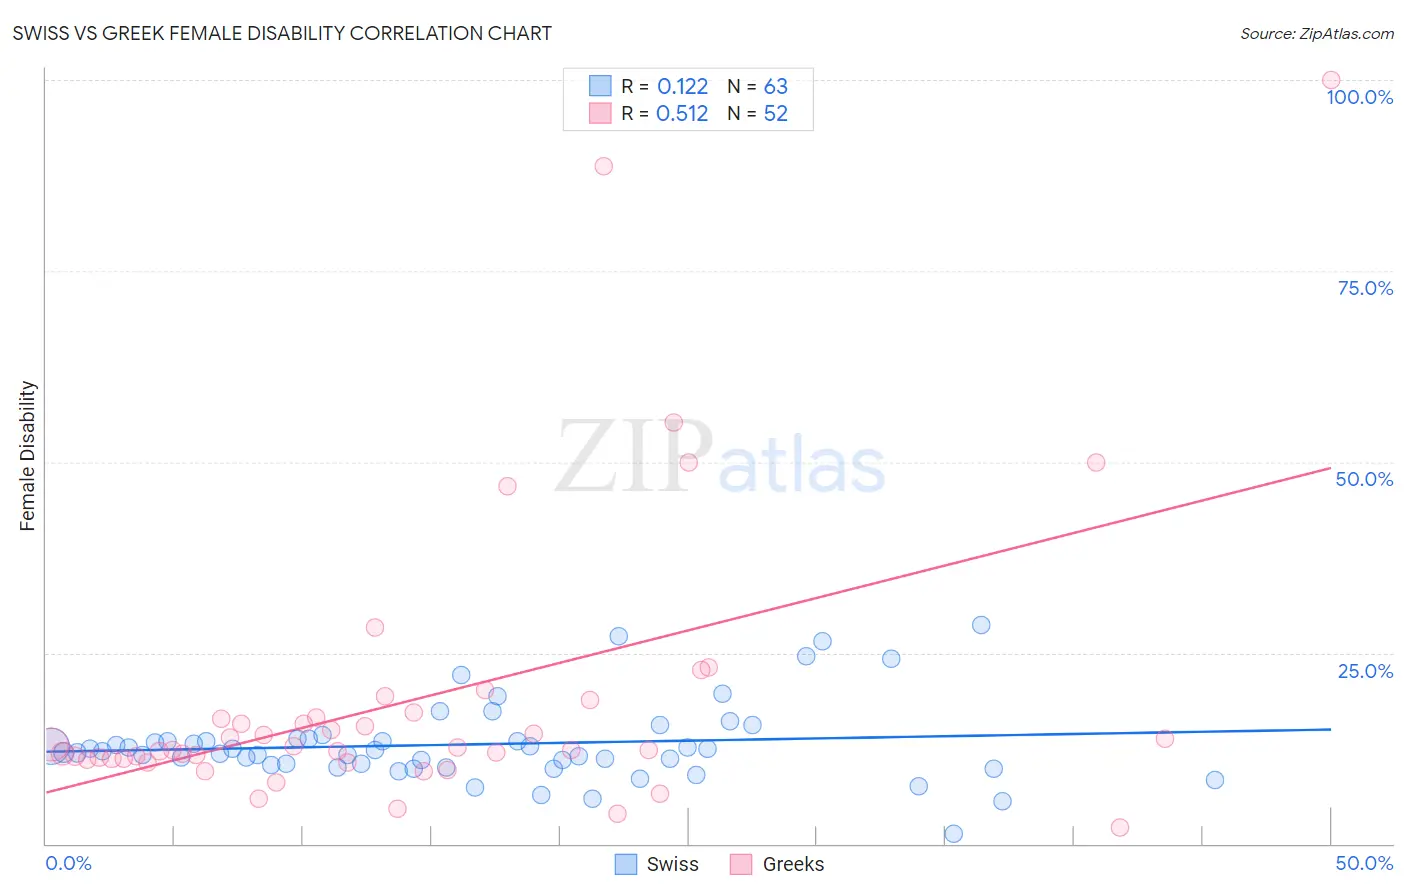
Swiss vs Greek Female Disability Correlation Chart
The statistical analysis conducted on geographies consisting of 464,961,657 people shows a poor positive correlation between the proportion of Swiss and percentage of females with a disability in the United States with a correlation coefficient (R) of 0.122 and weighted average of 12.4%. Similarly, the statistical analysis conducted on geographies consisting of 482,678,475 people shows a substantial positive correlation between the proportion of Greeks and percentage of females with a disability in the United States with a correlation coefficient (R) of 0.512 and weighted average of 12.0%, a difference of 3.1%.
Female Disability Correlation Summary
| Measurement | Swiss | Greek |
| Minimum | 1.3% | 2.2% |
| Maximum | 28.6% | 100.0% |
| Range | 27.3% | 97.8% |
| Mean | 13.0% | 19.0% |
| Median | 12.1% | 12.5% |
| Interquartile 25% (IQ1) | 10.4% | 11.1% |
| Interquartile 75% (IQ3) | 13.7% | 16.9% |
| Interquartile Range (IQR) | 3.3% | 5.8% |
| Standard Deviation (Sample) | 5.1% | 18.9% |
| Standard Deviation (Population) | 5.1% | 18.7% |
Similar Demographics by Female Disability
Demographics Similar to Swiss by Female Disability
In terms of female disability, the demographic groups most similar to Swiss are Immigrants from Bosnia and Herzegovina (12.4%, a difference of 0.010%), Ute (12.4%, a difference of 0.010%), Immigrants from Thailand (12.4%, a difference of 0.030%), Mexican (12.4%, a difference of 0.050%), and Panamanian (12.4%, a difference of 0.11%).
| Demographics | Rating | Rank | Female Disability |
| Immigrants | Barbados | 21.1 /100 | #203 | Fair 12.3% |
| Immigrants | Zaire | 20.9 /100 | #204 | Fair 12.3% |
| Immigrants | Grenada | 20.5 /100 | #205 | Fair 12.4% |
| Immigrants | Cuba | 20.2 /100 | #206 | Fair 12.4% |
| Croatians | 20.2 /100 | #207 | Fair 12.4% |
| Basques | 17.5 /100 | #208 | Poor 12.4% |
| Mexicans | 15.7 /100 | #209 | Poor 12.4% |
| Swiss | 14.9 /100 | #210 | Poor 12.4% |
| Immigrants | Bosnia and Herzegovina | 14.8 /100 | #211 | Poor 12.4% |
| Ute | 14.7 /100 | #212 | Poor 12.4% |
| Immigrants | Thailand | 14.5 /100 | #213 | Poor 12.4% |
| Panamanians | 13.5 /100 | #214 | Poor 12.4% |
| Samoans | 13.4 /100 | #215 | Poor 12.4% |
| Immigrants | Burma/Myanmar | 13.3 /100 | #216 | Poor 12.4% |
| British | 12.7 /100 | #217 | Poor 12.4% |
Demographics Similar to Greeks by Female Disability
In terms of female disability, the demographic groups most similar to Greeks are Immigrants from Moldova (12.0%, a difference of 0.030%), Immigrants from Kenya (12.0%, a difference of 0.070%), Icelander (12.0%, a difference of 0.080%), Nigerian (12.0%, a difference of 0.14%), and Immigrants from Scotland (12.0%, a difference of 0.16%).
| Demographics | Rating | Rank | Female Disability |
| Immigrants | Africa | 90.0 /100 | #142 | Excellent 11.9% |
| Immigrants | Sudan | 89.6 /100 | #143 | Excellent 11.9% |
| Immigrants | Austria | 87.9 /100 | #144 | Excellent 12.0% |
| Estonians | 87.8 /100 | #145 | Excellent 12.0% |
| Pakistanis | 84.6 /100 | #146 | Excellent 12.0% |
| Nigerians | 84.0 /100 | #147 | Excellent 12.0% |
| Immigrants | Kenya | 83.1 /100 | #148 | Excellent 12.0% |
| Greeks | 82.0 /100 | #149 | Excellent 12.0% |
| Immigrants | Moldova | 81.4 /100 | #150 | Excellent 12.0% |
| Icelanders | 80.7 /100 | #151 | Excellent 12.0% |
| Immigrants | Scotland | 79.3 /100 | #152 | Good 12.0% |
| Sudanese | 79.1 /100 | #153 | Good 12.0% |
| Syrians | 76.9 /100 | #154 | Good 12.1% |
| Ghanaians | 76.6 /100 | #155 | Good 12.1% |
| Moroccans | 72.9 /100 | #156 | Good 12.1% |