Swiss vs Japanese Female Disability
COMPARE
Swiss
Japanese
Female Disability
Female Disability Comparison
Swiss
Japanese
12.4%
FEMALE DISABILITY
14.9/ 100
METRIC RATING
210th/ 347
METRIC RANK
12.6%
FEMALE DISABILITY
2.7/ 100
METRIC RATING
241st/ 347
METRIC RANK
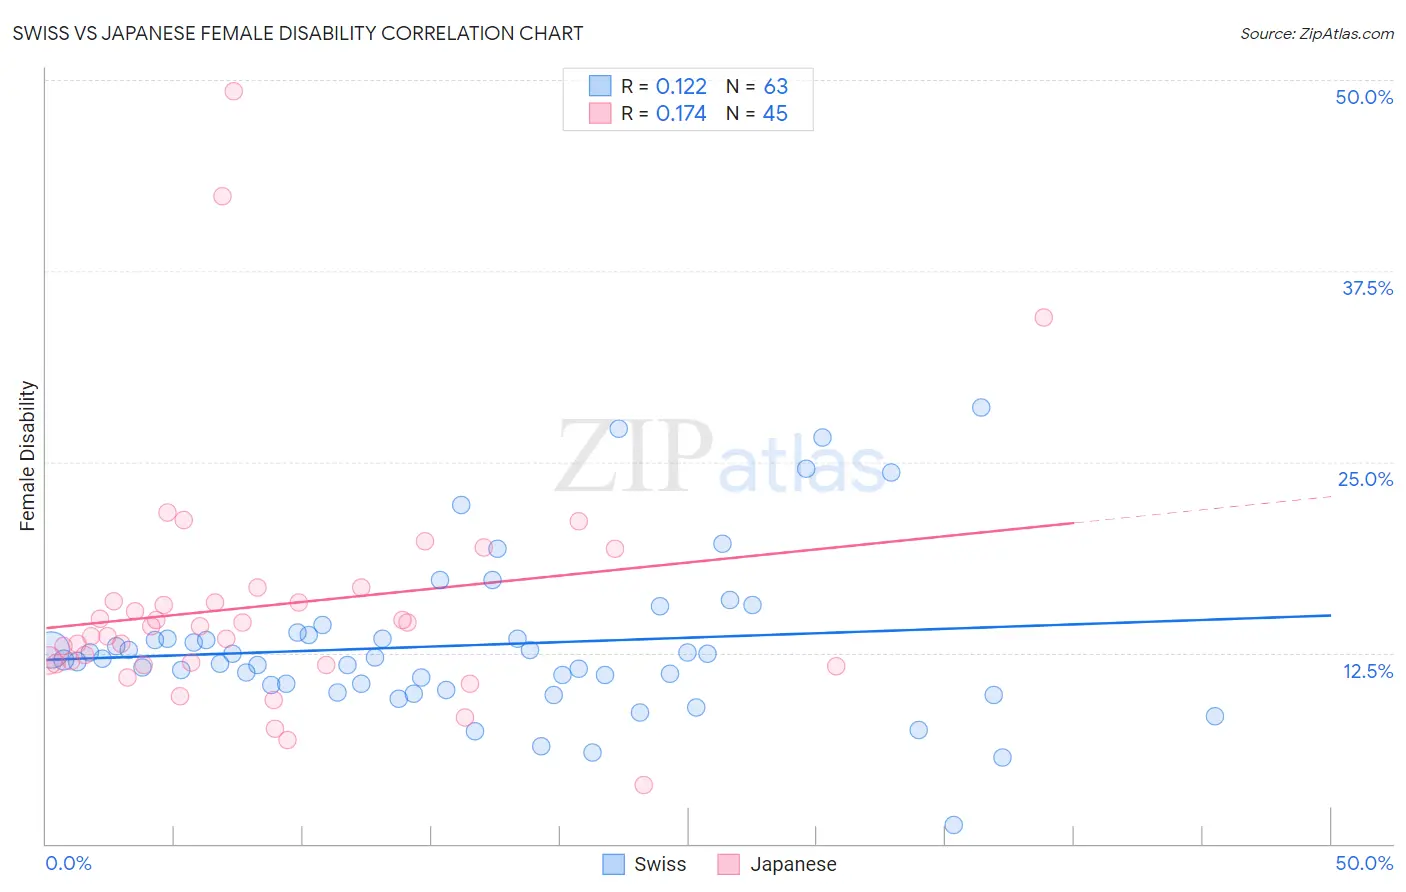
Swiss vs Japanese Female Disability Correlation Chart
The statistical analysis conducted on geographies consisting of 464,961,657 people shows a poor positive correlation between the proportion of Swiss and percentage of females with a disability in the United States with a correlation coefficient (R) of 0.122 and weighted average of 12.4%. Similarly, the statistical analysis conducted on geographies consisting of 249,148,020 people shows a poor positive correlation between the proportion of Japanese and percentage of females with a disability in the United States with a correlation coefficient (R) of 0.174 and weighted average of 12.6%, a difference of 1.7%.
Female Disability Correlation Summary
| Measurement | Swiss | Japanese |
| Minimum | 1.3% | 3.8% |
| Maximum | 28.6% | 49.3% |
| Range | 27.3% | 45.4% |
| Mean | 13.0% | 15.6% |
| Median | 12.1% | 14.2% |
| Interquartile 25% (IQ1) | 10.4% | 11.8% |
| Interquartile 75% (IQ3) | 13.7% | 16.3% |
| Interquartile Range (IQR) | 3.3% | 4.6% |
| Standard Deviation (Sample) | 5.1% | 8.2% |
| Standard Deviation (Population) | 5.1% | 8.1% |
Similar Demographics by Female Disability
Demographics Similar to Swiss by Female Disability
In terms of female disability, the demographic groups most similar to Swiss are Immigrants from Bosnia and Herzegovina (12.4%, a difference of 0.010%), Ute (12.4%, a difference of 0.010%), Immigrants from Thailand (12.4%, a difference of 0.030%), Mexican (12.4%, a difference of 0.050%), and Panamanian (12.4%, a difference of 0.11%).
| Demographics | Rating | Rank | Female Disability |
| Immigrants | Barbados | 21.1 /100 | #203 | Fair 12.3% |
| Immigrants | Zaire | 20.9 /100 | #204 | Fair 12.3% |
| Immigrants | Grenada | 20.5 /100 | #205 | Fair 12.4% |
| Immigrants | Cuba | 20.2 /100 | #206 | Fair 12.4% |
| Croatians | 20.2 /100 | #207 | Fair 12.4% |
| Basques | 17.5 /100 | #208 | Poor 12.4% |
| Mexicans | 15.7 /100 | #209 | Poor 12.4% |
| Swiss | 14.9 /100 | #210 | Poor 12.4% |
| Immigrants | Bosnia and Herzegovina | 14.8 /100 | #211 | Poor 12.4% |
| Ute | 14.7 /100 | #212 | Poor 12.4% |
| Immigrants | Thailand | 14.5 /100 | #213 | Poor 12.4% |
| Panamanians | 13.5 /100 | #214 | Poor 12.4% |
| Samoans | 13.4 /100 | #215 | Poor 12.4% |
| Immigrants | Burma/Myanmar | 13.3 /100 | #216 | Poor 12.4% |
| British | 12.7 /100 | #217 | Poor 12.4% |
Demographics Similar to Japanese by Female Disability
In terms of female disability, the demographic groups most similar to Japanese are Canadian (12.6%, a difference of 0.050%), Immigrants from Senegal (12.6%, a difference of 0.060%), Alsatian (12.6%, a difference of 0.070%), German Russian (12.6%, a difference of 0.17%), and Immigrants from Jamaica (12.6%, a difference of 0.21%).
| Demographics | Rating | Rank | Female Disability |
| Scandinavians | 5.3 /100 | #234 | Tragic 12.5% |
| Malaysians | 5.0 /100 | #235 | Tragic 12.5% |
| Immigrants | West Indies | 4.4 /100 | #236 | Tragic 12.6% |
| Slavs | 3.8 /100 | #237 | Tragic 12.6% |
| Yugoslavians | 3.7 /100 | #238 | Tragic 12.6% |
| Barbadians | 3.6 /100 | #239 | Tragic 12.6% |
| German Russians | 3.2 /100 | #240 | Tragic 12.6% |
| Japanese | 2.7 /100 | #241 | Tragic 12.6% |
| Canadians | 2.6 /100 | #242 | Tragic 12.6% |
| Immigrants | Senegal | 2.5 /100 | #243 | Tragic 12.6% |
| Alsatians | 2.5 /100 | #244 | Tragic 12.6% |
| Immigrants | Jamaica | 2.2 /100 | #245 | Tragic 12.6% |
| Spanish American Indians | 2.1 /100 | #246 | Tragic 12.6% |
| Menominee | 2.1 /100 | #247 | Tragic 12.6% |
| Carpatho Rusyns | 2.0 /100 | #248 | Tragic 12.6% |