Immigrants from Cambodia vs Immigrants from Pakistan Disability Age Under 5
COMPARE
Immigrants from Cambodia
Immigrants from Pakistan
Disability Age Under 5
Disability Age Under 5 Comparison
Immigrants from Cambodia
Immigrants from Pakistan
1.2%
DISABILITY AGE UNDER 5
90.5/ 100
METRIC RATING
124th/ 347
METRIC RANK
1.1%
DISABILITY AGE UNDER 5
98.4/ 100
METRIC RATING
75th/ 347
METRIC RANK
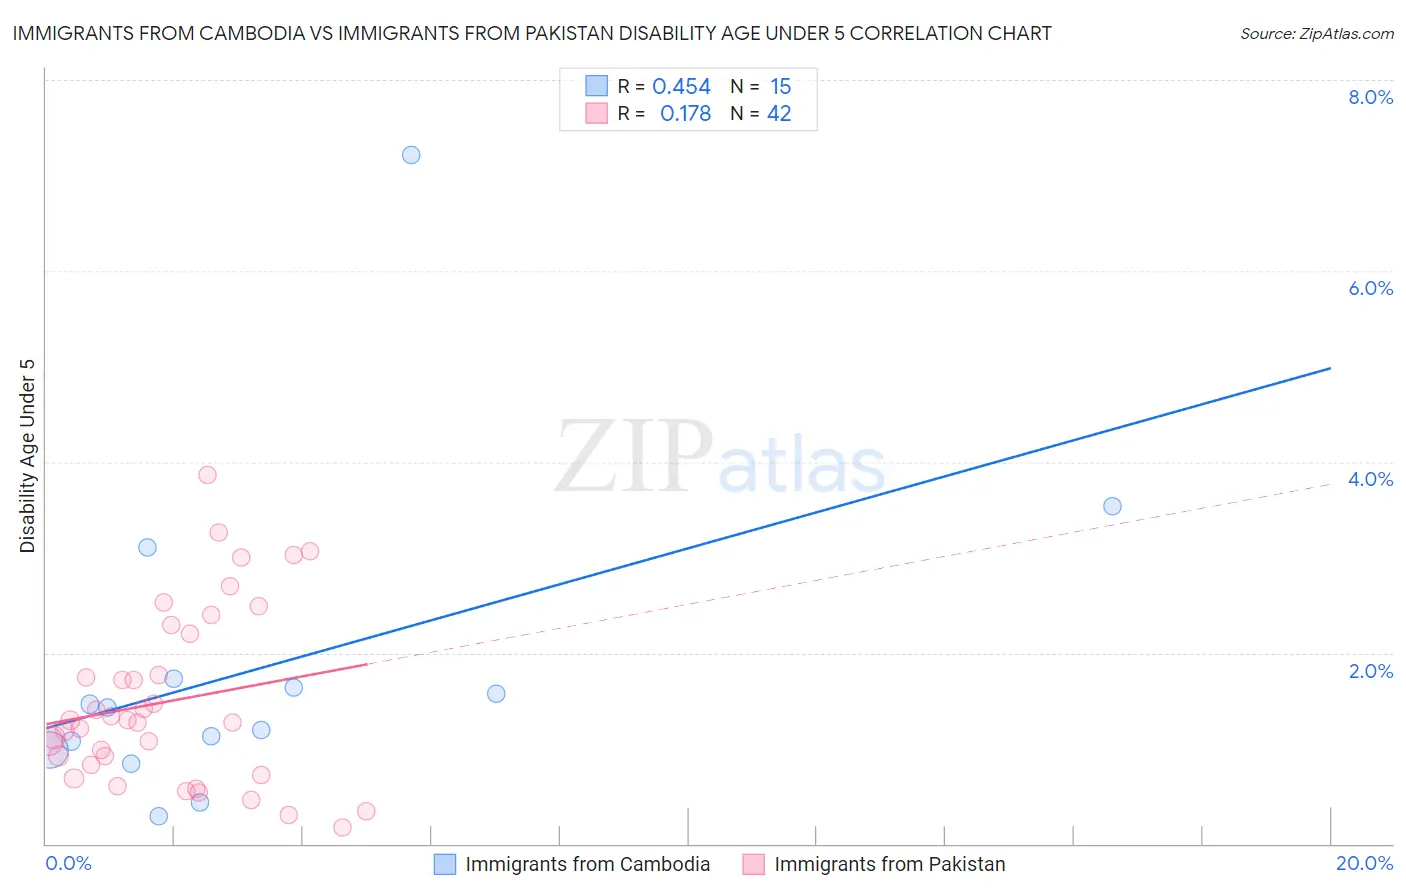
Immigrants from Cambodia vs Immigrants from Pakistan Disability Age Under 5 Correlation Chart
The statistical analysis conducted on geographies consisting of 138,793,023 people shows a moderate positive correlation between the proportion of Immigrants from Cambodia and percentage of population with a disability under the age of 5 in the United States with a correlation coefficient (R) of 0.454 and weighted average of 1.2%. Similarly, the statistical analysis conducted on geographies consisting of 169,764,287 people shows a poor positive correlation between the proportion of Immigrants from Pakistan and percentage of population with a disability under the age of 5 in the United States with a correlation coefficient (R) of 0.178 and weighted average of 1.1%, a difference of 4.6%.
Disability Age Under 5 Correlation Summary
| Measurement | Immigrants from Cambodia | Immigrants from Pakistan |
| Minimum | 0.29% | 0.17% |
| Maximum | 7.2% | 3.9% |
| Range | 6.9% | 3.7% |
| Mean | 1.8% | 1.5% |
| Median | 1.4% | 1.3% |
| Interquartile 25% (IQ1) | 0.98% | 0.82% |
| Interquartile 75% (IQ3) | 1.7% | 2.2% |
| Interquartile Range (IQR) | 0.75% | 1.4% |
| Standard Deviation (Sample) | 1.7% | 0.91% |
| Standard Deviation (Population) | 1.7% | 0.90% |
Similar Demographics by Disability Age Under 5
Demographics Similar to Immigrants from Cambodia by Disability Age Under 5
In terms of disability age under 5, the demographic groups most similar to Immigrants from Cambodia are Zimbabwean (1.2%, a difference of 0.020%), Japanese (1.2%, a difference of 0.060%), Aleut (1.2%, a difference of 0.070%), Central American (1.2%, a difference of 0.22%), and Immigrants from Senegal (1.2%, a difference of 0.26%).
| Demographics | Rating | Rank | Disability Age Under 5 |
| Immigrants | Philippines | 93.5 /100 | #117 | Exceptional 1.2% |
| Immigrants | Venezuela | 93.4 /100 | #118 | Exceptional 1.2% |
| Bhutanese | 92.5 /100 | #119 | Exceptional 1.2% |
| Immigrants | Eritrea | 92.3 /100 | #120 | Exceptional 1.2% |
| Immigrants | Senegal | 91.4 /100 | #121 | Exceptional 1.2% |
| Aleuts | 90.7 /100 | #122 | Exceptional 1.2% |
| Zimbabweans | 90.6 /100 | #123 | Exceptional 1.2% |
| Immigrants | Cambodia | 90.5 /100 | #124 | Exceptional 1.2% |
| Japanese | 90.3 /100 | #125 | Exceptional 1.2% |
| Central Americans | 89.7 /100 | #126 | Excellent 1.2% |
| Immigrants | Romania | 88.4 /100 | #127 | Excellent 1.2% |
| Immigrants | France | 88.4 /100 | #128 | Excellent 1.2% |
| Immigrants | Immigrants | 88.0 /100 | #129 | Excellent 1.2% |
| Koreans | 87.7 /100 | #130 | Excellent 1.2% |
| Immigrants | Serbia | 87.6 /100 | #131 | Excellent 1.2% |
Demographics Similar to Immigrants from Pakistan by Disability Age Under 5
In terms of disability age under 5, the demographic groups most similar to Immigrants from Pakistan are Immigrants from Sri Lanka (1.1%, a difference of 0.090%), Jordanian (1.1%, a difference of 0.090%), Burmese (1.1%, a difference of 0.17%), Immigrants from Burma/Myanmar (1.1%, a difference of 0.26%), and Trinidadian and Tobagonian (1.1%, a difference of 0.33%).
| Demographics | Rating | Rank | Disability Age Under 5 |
| South Africans | 98.7 /100 | #68 | Exceptional 1.1% |
| Israelis | 98.7 /100 | #69 | Exceptional 1.1% |
| Immigrants | Ecuador | 98.6 /100 | #70 | Exceptional 1.1% |
| Trinidadians and Tobagonians | 98.6 /100 | #71 | Exceptional 1.1% |
| Burmese | 98.5 /100 | #72 | Exceptional 1.1% |
| Immigrants | Sri Lanka | 98.5 /100 | #73 | Exceptional 1.1% |
| Jordanians | 98.5 /100 | #74 | Exceptional 1.1% |
| Immigrants | Pakistan | 98.4 /100 | #75 | Exceptional 1.1% |
| Immigrants | Burma/Myanmar | 98.2 /100 | #76 | Exceptional 1.1% |
| Immigrants | Denmark | 98.1 /100 | #77 | Exceptional 1.1% |
| West Indians | 98.0 /100 | #78 | Exceptional 1.1% |
| Hmong | 98.0 /100 | #79 | Exceptional 1.1% |
| Immigrants | Trinidad and Tobago | 98.0 /100 | #80 | Exceptional 1.1% |
| Turks | 98.0 /100 | #81 | Exceptional 1.1% |
| Immigrants | Jordan | 97.9 /100 | #82 | Exceptional 1.1% |