Subsaharan African vs Greek Female Disability
COMPARE
Subsaharan African
Greek
Female Disability
Female Disability Comparison
Sub-Saharan Africans
Greeks
12.7%
FEMALE DISABILITY
1.0/ 100
METRIC RATING
260th/ 347
METRIC RANK
12.0%
FEMALE DISABILITY
82.0/ 100
METRIC RATING
149th/ 347
METRIC RANK
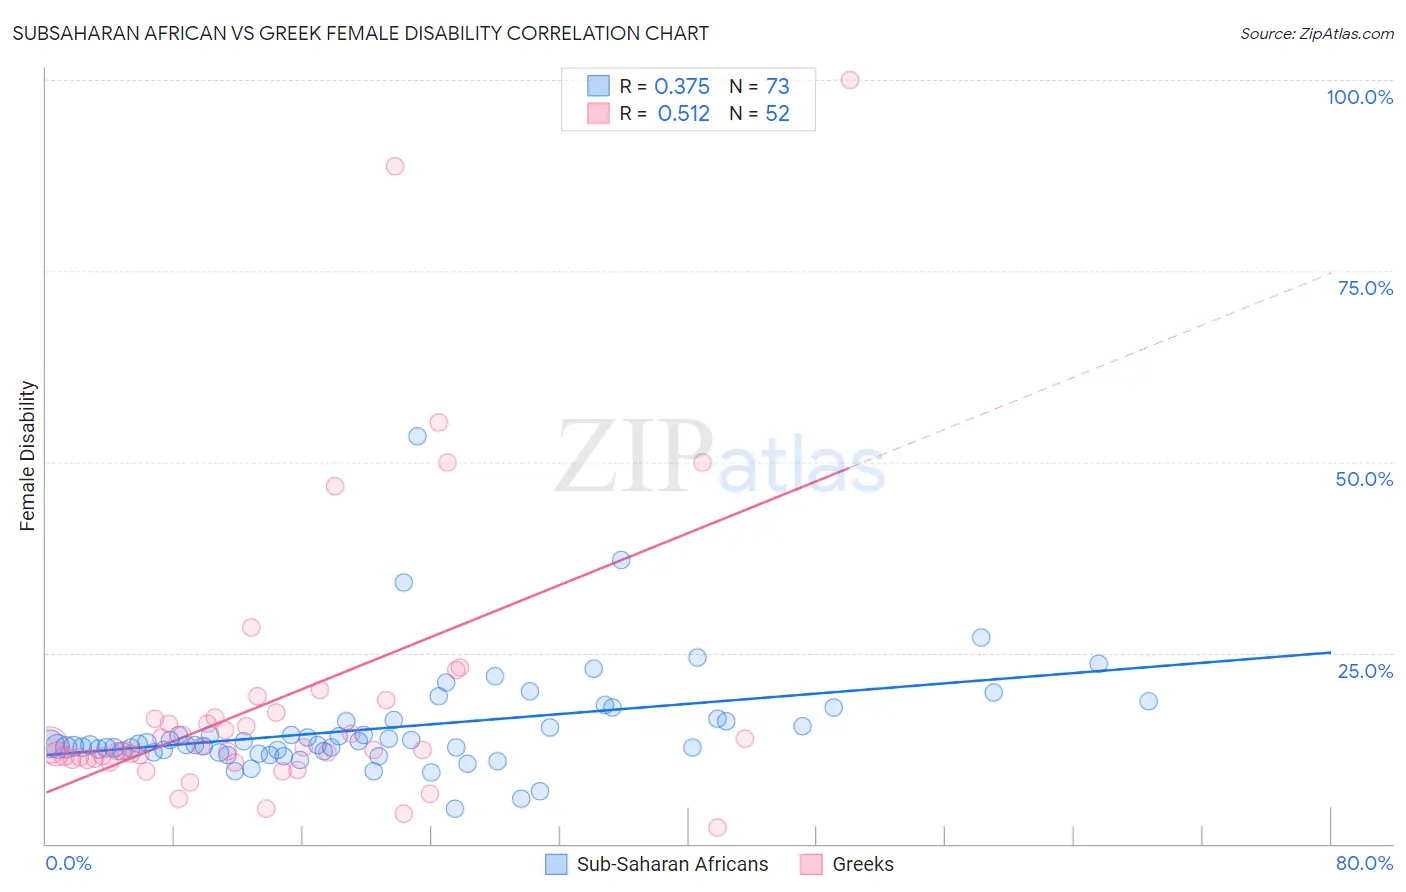
Subsaharan African vs Greek Female Disability Correlation Chart
The statistical analysis conducted on geographies consisting of 508,044,435 people shows a mild positive correlation between the proportion of Sub-Saharan Africans and percentage of females with a disability in the United States with a correlation coefficient (R) of 0.375 and weighted average of 12.7%. Similarly, the statistical analysis conducted on geographies consisting of 482,678,475 people shows a substantial positive correlation between the proportion of Greeks and percentage of females with a disability in the United States with a correlation coefficient (R) of 0.512 and weighted average of 12.0%, a difference of 5.8%.
Female Disability Correlation Summary
| Measurement | Subsaharan African | Greek |
| Minimum | 4.5% | 2.2% |
| Maximum | 53.3% | 100.0% |
| Range | 48.8% | 97.8% |
| Mean | 15.1% | 19.0% |
| Median | 12.9% | 12.5% |
| Interquartile 25% (IQ1) | 12.1% | 11.1% |
| Interquartile 75% (IQ3) | 16.1% | 16.9% |
| Interquartile Range (IQR) | 4.0% | 5.8% |
| Standard Deviation (Sample) | 7.0% | 18.9% |
| Standard Deviation (Population) | 7.0% | 18.7% |
Similar Demographics by Female Disability
Demographics Similar to Sub-Saharan Africans by Female Disability
In terms of female disability, the demographic groups most similar to Sub-Saharan Africans are Immigrants from Armenia (12.7%, a difference of 0.010%), Bermudan (12.7%, a difference of 0.040%), Aleut (12.7%, a difference of 0.090%), Liberian (12.7%, a difference of 0.10%), and Czechoslovakian (12.7%, a difference of 0.11%).
| Demographics | Rating | Rank | Female Disability |
| Jamaicans | 1.4 /100 | #253 | Tragic 12.7% |
| Hawaiians | 1.4 /100 | #254 | Tragic 12.7% |
| Immigrants | Germany | 1.3 /100 | #255 | Tragic 12.7% |
| British West Indians | 1.2 /100 | #256 | Tragic 12.7% |
| Liberians | 1.1 /100 | #257 | Tragic 12.7% |
| Aleuts | 1.1 /100 | #258 | Tragic 12.7% |
| Immigrants | Armenia | 1.0 /100 | #259 | Tragic 12.7% |
| Sub-Saharan Africans | 1.0 /100 | #260 | Tragic 12.7% |
| Bermudans | 1.0 /100 | #261 | Tragic 12.7% |
| Czechoslovakians | 0.9 /100 | #262 | Tragic 12.7% |
| Spaniards | 0.7 /100 | #263 | Tragic 12.8% |
| Alaska Natives | 0.6 /100 | #264 | Tragic 12.8% |
| West Indians | 0.5 /100 | #265 | Tragic 12.8% |
| Finns | 0.4 /100 | #266 | Tragic 12.8% |
| Senegalese | 0.4 /100 | #267 | Tragic 12.8% |
Demographics Similar to Greeks by Female Disability
In terms of female disability, the demographic groups most similar to Greeks are Immigrants from Moldova (12.0%, a difference of 0.030%), Immigrants from Kenya (12.0%, a difference of 0.070%), Icelander (12.0%, a difference of 0.080%), Nigerian (12.0%, a difference of 0.14%), and Immigrants from Scotland (12.0%, a difference of 0.16%).
| Demographics | Rating | Rank | Female Disability |
| Immigrants | Africa | 90.0 /100 | #142 | Excellent 11.9% |
| Immigrants | Sudan | 89.6 /100 | #143 | Excellent 11.9% |
| Immigrants | Austria | 87.9 /100 | #144 | Excellent 12.0% |
| Estonians | 87.8 /100 | #145 | Excellent 12.0% |
| Pakistanis | 84.6 /100 | #146 | Excellent 12.0% |
| Nigerians | 84.0 /100 | #147 | Excellent 12.0% |
| Immigrants | Kenya | 83.1 /100 | #148 | Excellent 12.0% |
| Greeks | 82.0 /100 | #149 | Excellent 12.0% |
| Immigrants | Moldova | 81.4 /100 | #150 | Excellent 12.0% |
| Icelanders | 80.7 /100 | #151 | Excellent 12.0% |
| Immigrants | Scotland | 79.3 /100 | #152 | Good 12.0% |
| Sudanese | 79.1 /100 | #153 | Good 12.0% |
| Syrians | 76.9 /100 | #154 | Good 12.1% |
| Ghanaians | 76.6 /100 | #155 | Good 12.1% |
| Moroccans | 72.9 /100 | #156 | Good 12.1% |