Dutch West Indian vs Immigrants from South Africa Disability
COMPARE
Dutch West Indian
Immigrants from South Africa
Disability
Disability Comparison
Dutch West Indians
Immigrants from South Africa
14.9%
DISABILITY
0.0/ 100
METRIC RATING
338th/ 347
METRIC RANK
11.2%
DISABILITY
98.2/ 100
METRIC RATING
89th/ 347
METRIC RANK
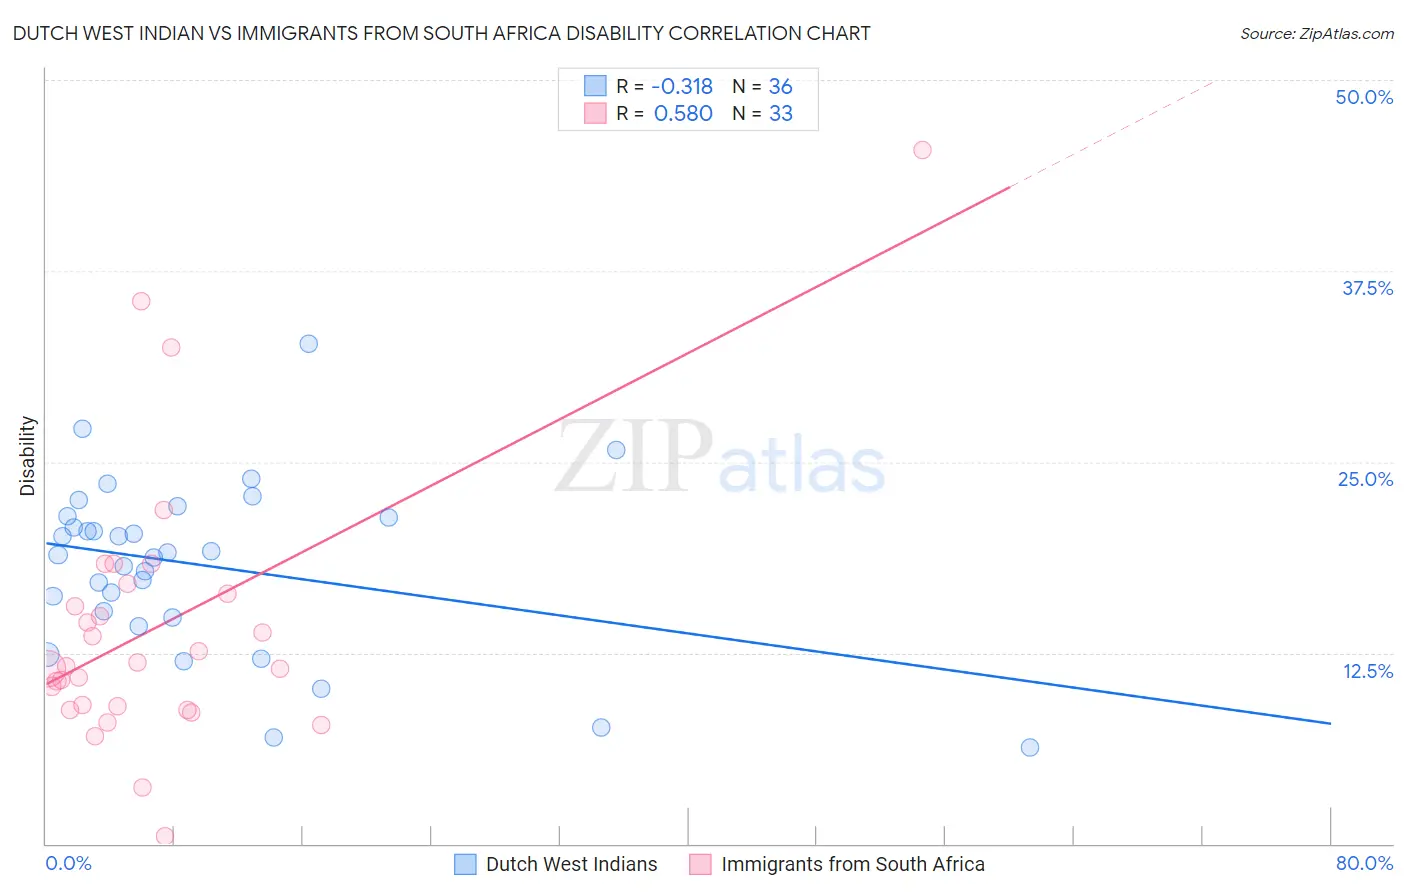
Dutch West Indian vs Immigrants from South Africa Disability Correlation Chart
The statistical analysis conducted on geographies consisting of 85,770,416 people shows a mild negative correlation between the proportion of Dutch West Indians and percentage of population with a disability in the United States with a correlation coefficient (R) of -0.318 and weighted average of 14.9%. Similarly, the statistical analysis conducted on geographies consisting of 233,313,219 people shows a substantial positive correlation between the proportion of Immigrants from South Africa and percentage of population with a disability in the United States with a correlation coefficient (R) of 0.580 and weighted average of 11.2%, a difference of 33.3%.
Disability Correlation Summary
| Measurement | Dutch West Indian | Immigrants from South Africa |
| Minimum | 6.3% | 0.46% |
| Maximum | 32.7% | 45.5% |
| Range | 26.4% | 45.0% |
| Mean | 18.2% | 14.2% |
| Median | 19.0% | 11.7% |
| Interquartile 25% (IQ1) | 15.0% | 8.9% |
| Interquartile 75% (IQ3) | 21.4% | 16.7% |
| Interquartile Range (IQR) | 6.4% | 7.8% |
| Standard Deviation (Sample) | 5.7% | 8.9% |
| Standard Deviation (Population) | 5.6% | 8.8% |
Similar Demographics by Disability
Demographics Similar to Dutch West Indians by Disability
In terms of disability, the demographic groups most similar to Dutch West Indians are Seminole (14.9%, a difference of 0.30%), Cherokee (14.8%, a difference of 0.39%), Tohono O'odham (14.8%, a difference of 0.91%), Chickasaw (15.2%, a difference of 1.8%), and Yuman (14.6%, a difference of 1.9%).
| Demographics | Rating | Rank | Disability |
| Alaskan Athabascans | 0.0 /100 | #331 | Tragic 14.4% |
| Pueblo | 0.0 /100 | #332 | Tragic 14.4% |
| Cajuns | 0.0 /100 | #333 | Tragic 14.6% |
| Yuman | 0.0 /100 | #334 | Tragic 14.6% |
| Tohono O'odham | 0.0 /100 | #335 | Tragic 14.8% |
| Cherokee | 0.0 /100 | #336 | Tragic 14.8% |
| Seminole | 0.0 /100 | #337 | Tragic 14.9% |
| Dutch West Indians | 0.0 /100 | #338 | Tragic 14.9% |
| Chickasaw | 0.0 /100 | #339 | Tragic 15.2% |
| Choctaw | 0.0 /100 | #340 | Tragic 15.4% |
| Lumbee | 0.0 /100 | #341 | Tragic 15.5% |
| Kiowa | 0.0 /100 | #342 | Tragic 15.6% |
| Creek | 0.0 /100 | #343 | Tragic 15.6% |
| Colville | 0.0 /100 | #344 | Tragic 15.8% |
| Puerto Ricans | 0.0 /100 | #345 | Tragic 16.1% |
Demographics Similar to Immigrants from South Africa by Disability
In terms of disability, the demographic groups most similar to Immigrants from South Africa are Immigrants from Brazil (11.2%, a difference of 0.050%), Immigrants from Western Asia (11.2%, a difference of 0.070%), Ecuadorian (11.2%, a difference of 0.11%), Immigrants from Ecuador (11.2%, a difference of 0.11%), and Immigrants from Morocco (11.2%, a difference of 0.23%).
| Demographics | Rating | Rank | Disability |
| Chileans | 99.1 /100 | #82 | Exceptional 11.1% |
| Immigrants | Switzerland | 99.0 /100 | #83 | Exceptional 11.1% |
| Immigrants | Sierra Leone | 99.0 /100 | #84 | Exceptional 11.1% |
| Immigrants | Belarus | 98.9 /100 | #85 | Exceptional 11.1% |
| Immigrants | Russia | 98.9 /100 | #86 | Exceptional 11.1% |
| Palestinians | 98.9 /100 | #87 | Exceptional 11.1% |
| Immigrants | Romania | 98.5 /100 | #88 | Exceptional 11.2% |
| Immigrants | South Africa | 98.2 /100 | #89 | Exceptional 11.2% |
| Immigrants | Brazil | 98.1 /100 | #90 | Exceptional 11.2% |
| Immigrants | Western Asia | 98.1 /100 | #91 | Exceptional 11.2% |
| Ecuadorians | 98.0 /100 | #92 | Exceptional 11.2% |
| Immigrants | Ecuador | 98.0 /100 | #93 | Exceptional 11.2% |
| Immigrants | Morocco | 97.8 /100 | #94 | Exceptional 11.2% |
| Eastern Europeans | 97.8 /100 | #95 | Exceptional 11.2% |
| Immigrants | Zimbabwe | 97.7 /100 | #96 | Exceptional 11.2% |