Swedish vs Ukrainian Ambulatory Disability
COMPARE
Swedish
Ukrainian
Ambulatory Disability
Ambulatory Disability Comparison
Swedes
Ukrainians
6.0%
AMBULATORY DISABILITY
83.1/ 100
METRIC RATING
141st/ 347
METRIC RANK
6.2%
AMBULATORY DISABILITY
34.0/ 100
METRIC RATING
189th/ 347
METRIC RANK
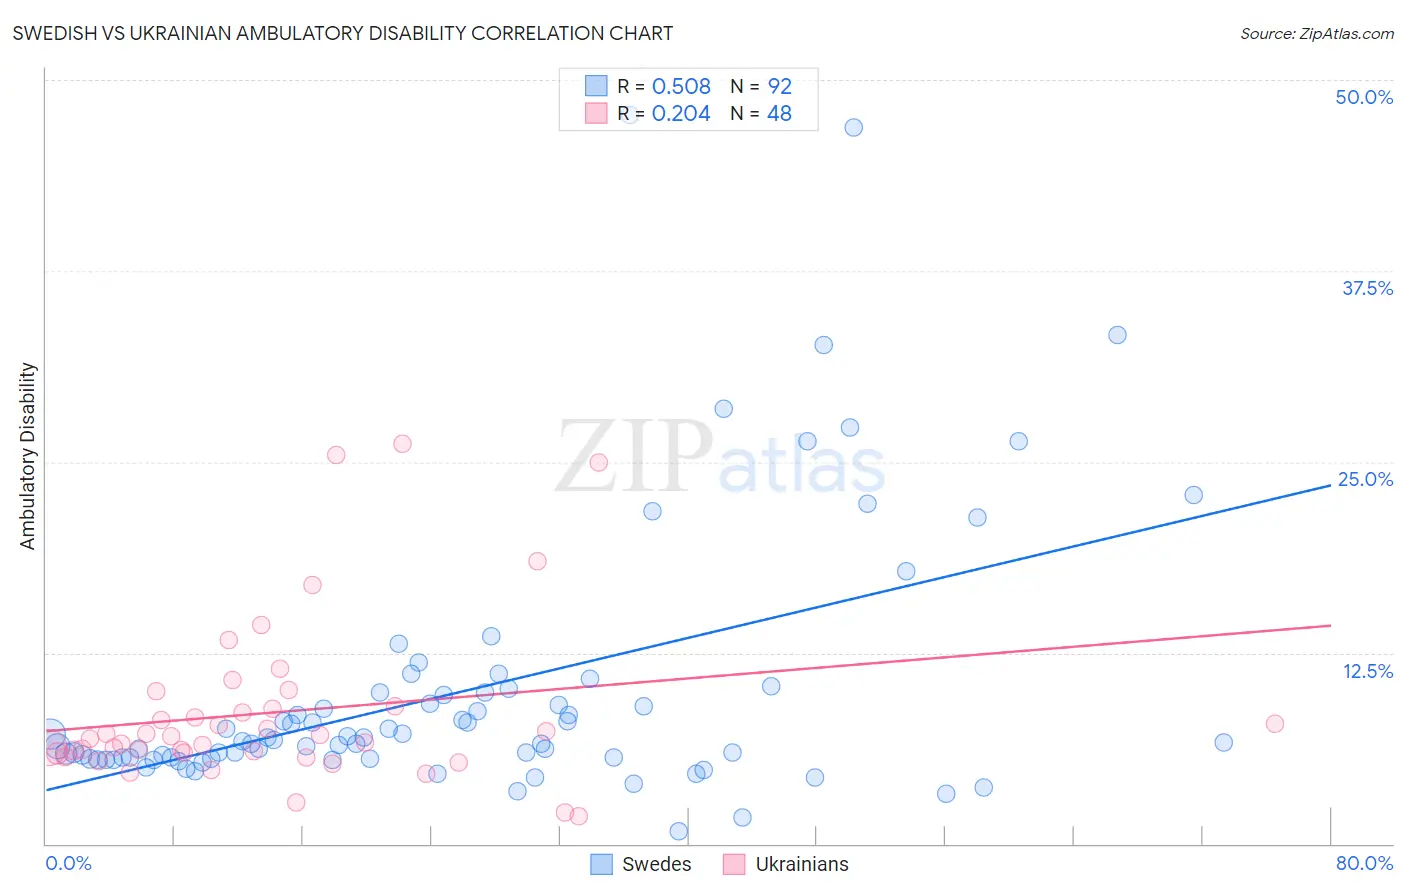
Swedish vs Ukrainian Ambulatory Disability Correlation Chart
The statistical analysis conducted on geographies consisting of 538,852,545 people shows a substantial positive correlation between the proportion of Swedes and percentage of population with ambulatory disability in the United States with a correlation coefficient (R) of 0.508 and weighted average of 6.0%. Similarly, the statistical analysis conducted on geographies consisting of 448,487,424 people shows a weak positive correlation between the proportion of Ukrainians and percentage of population with ambulatory disability in the United States with a correlation coefficient (R) of 0.204 and weighted average of 6.2%, a difference of 3.1%.
Ambulatory Disability Correlation Summary
| Measurement | Swedish | Ukrainian |
| Minimum | 0.84% | 1.8% |
| Maximum | 47.7% | 26.2% |
| Range | 46.9% | 24.4% |
| Mean | 9.9% | 8.6% |
| Median | 6.7% | 6.9% |
| Interquartile 25% (IQ1) | 5.6% | 5.9% |
| Interquartile 75% (IQ3) | 9.8% | 8.9% |
| Interquartile Range (IQR) | 4.3% | 3.0% |
| Standard Deviation (Sample) | 8.7% | 5.5% |
| Standard Deviation (Population) | 8.6% | 5.4% |
Similar Demographics by Ambulatory Disability
Demographics Similar to Swedes by Ambulatory Disability
In terms of ambulatory disability, the demographic groups most similar to Swedes are Immigrants from Philippines (6.0%, a difference of 0.010%), Czech (6.0%, a difference of 0.020%), Romanian (6.0%, a difference of 0.020%), Macedonian (6.0%, a difference of 0.030%), and Immigrants from Zaire (6.0%, a difference of 0.050%).
| Demographics | Rating | Rank | Ambulatory Disability |
| Ute | 86.6 /100 | #134 | Excellent 6.0% |
| Immigrants | Italy | 85.0 /100 | #135 | Excellent 6.0% |
| Immigrants | North Macedonia | 84.1 /100 | #136 | Excellent 6.0% |
| Immigrants | Syria | 84.1 /100 | #137 | Excellent 6.0% |
| Immigrants | Hungary | 83.9 /100 | #138 | Excellent 6.0% |
| Immigrants | Zaire | 83.6 /100 | #139 | Excellent 6.0% |
| Czechs | 83.3 /100 | #140 | Excellent 6.0% |
| Swedes | 83.1 /100 | #141 | Excellent 6.0% |
| Immigrants | Philippines | 83.0 /100 | #142 | Excellent 6.0% |
| Romanians | 82.9 /100 | #143 | Excellent 6.0% |
| Macedonians | 82.8 /100 | #144 | Excellent 6.0% |
| Pakistanis | 82.5 /100 | #145 | Excellent 6.0% |
| Immigrants | Greece | 82.5 /100 | #146 | Excellent 6.0% |
| Immigrants | Moldova | 82.4 /100 | #147 | Excellent 6.0% |
| Immigrants | Eastern Europe | 82.0 /100 | #148 | Excellent 6.0% |
Demographics Similar to Ukrainians by Ambulatory Disability
In terms of ambulatory disability, the demographic groups most similar to Ukrainians are British (6.2%, a difference of 0.020%), Immigrants from Western Africa (6.2%, a difference of 0.040%), Carpatho Rusyn (6.2%, a difference of 0.080%), Immigrants from Guatemala (6.2%, a difference of 0.12%), and European (6.2%, a difference of 0.13%).
| Demographics | Rating | Rank | Ambulatory Disability |
| Serbians | 42.8 /100 | #182 | Average 6.1% |
| Immigrants | Thailand | 42.2 /100 | #183 | Average 6.1% |
| Immigrants | Ghana | 41.2 /100 | #184 | Average 6.1% |
| Immigrants | Bosnia and Herzegovina | 37.2 /100 | #185 | Fair 6.2% |
| Europeans | 36.2 /100 | #186 | Fair 6.2% |
| Carpatho Rusyns | 35.3 /100 | #187 | Fair 6.2% |
| British | 34.3 /100 | #188 | Fair 6.2% |
| Ukrainians | 34.0 /100 | #189 | Fair 6.2% |
| Immigrants | Western Africa | 33.4 /100 | #190 | Fair 6.2% |
| Immigrants | Guatemala | 31.9 /100 | #191 | Fair 6.2% |
| Immigrants | Western Europe | 31.6 /100 | #192 | Fair 6.2% |
| Guatemalans | 30.0 /100 | #193 | Fair 6.2% |
| Alaska Natives | 29.8 /100 | #194 | Fair 6.2% |
| Belgians | 28.6 /100 | #195 | Fair 6.2% |
| Malaysians | 28.2 /100 | #196 | Fair 6.2% |