Burmese vs Mongolian Disability
COMPARE
Burmese
Mongolian
Disability
Disability Comparison
Burmese
Mongolians
10.4%
DISABILITY
100.0/ 100
METRIC RATING
18th/ 347
METRIC RANK
10.8%
DISABILITY
99.9/ 100
METRIC RATING
40th/ 347
METRIC RANK
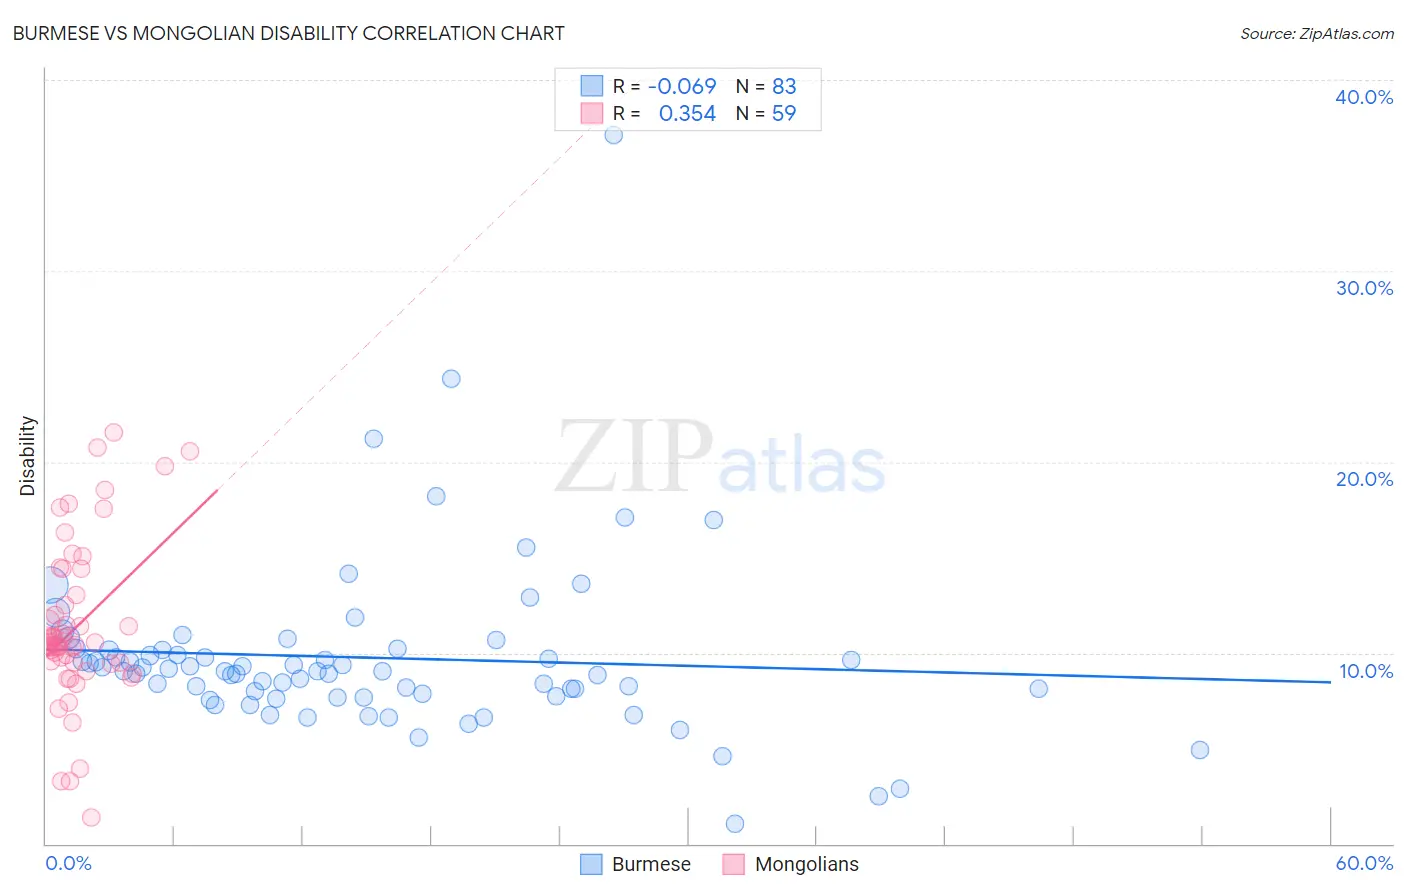
Burmese vs Mongolian Disability Correlation Chart
The statistical analysis conducted on geographies consisting of 465,330,582 people shows a slight negative correlation between the proportion of Burmese and percentage of population with a disability in the United States with a correlation coefficient (R) of -0.069 and weighted average of 10.4%. Similarly, the statistical analysis conducted on geographies consisting of 140,360,971 people shows a mild positive correlation between the proportion of Mongolians and percentage of population with a disability in the United States with a correlation coefficient (R) of 0.354 and weighted average of 10.8%, a difference of 3.8%.
Disability Correlation Summary
| Measurement | Burmese | Mongolian |
| Minimum | 1.1% | 1.4% |
| Maximum | 37.1% | 21.6% |
| Range | 36.1% | 20.2% |
| Mean | 9.7% | 11.3% |
| Median | 9.0% | 10.5% |
| Interquartile 25% (IQ1) | 7.7% | 9.5% |
| Interquartile 75% (IQ3) | 10.2% | 13.0% |
| Interquartile Range (IQR) | 2.4% | 3.5% |
| Standard Deviation (Sample) | 4.7% | 4.2% |
| Standard Deviation (Population) | 4.6% | 4.2% |
Similar Demographics by Disability
Demographics Similar to Burmese by Disability
In terms of disability, the demographic groups most similar to Burmese are Immigrants from Pakistan (10.4%, a difference of 0.010%), Immigrants from Venezuela (10.4%, a difference of 0.70%), Asian (10.4%, a difference of 0.72%), Immigrants from Sri Lanka (10.5%, a difference of 0.83%), and Immigrants from Iran (10.3%, a difference of 0.99%).
| Demographics | Rating | Rank | Disability |
| Iranians | 100.0 /100 | #11 | Exceptional 10.1% |
| Immigrants | Israel | 100.0 /100 | #12 | Exceptional 10.1% |
| Immigrants | Eastern Asia | 100.0 /100 | #13 | Exceptional 10.2% |
| Immigrants | Korea | 100.0 /100 | #14 | Exceptional 10.2% |
| Okinawans | 100.0 /100 | #15 | Exceptional 10.3% |
| Indians (Asian) | 100.0 /100 | #16 | Exceptional 10.3% |
| Immigrants | Iran | 100.0 /100 | #17 | Exceptional 10.3% |
| Burmese | 100.0 /100 | #18 | Exceptional 10.4% |
| Immigrants | Pakistan | 100.0 /100 | #19 | Exceptional 10.4% |
| Immigrants | Venezuela | 100.0 /100 | #20 | Exceptional 10.4% |
| Asians | 100.0 /100 | #21 | Exceptional 10.4% |
| Immigrants | Sri Lanka | 100.0 /100 | #22 | Exceptional 10.5% |
| Immigrants | Asia | 100.0 /100 | #23 | Exceptional 10.5% |
| Venezuelans | 100.0 /100 | #24 | Exceptional 10.5% |
| Immigrants | Malaysia | 100.0 /100 | #25 | Exceptional 10.6% |
Demographics Similar to Mongolians by Disability
In terms of disability, the demographic groups most similar to Mongolians are Cambodian (10.8%, a difference of 0.0%), Immigrants from Australia (10.8%, a difference of 0.040%), Afghan (10.8%, a difference of 0.10%), Immigrants from Nepal (10.8%, a difference of 0.14%), and Israeli (10.8%, a difference of 0.19%).
| Demographics | Rating | Rank | Disability |
| Immigrants | Kuwait | 100.0 /100 | #33 | Exceptional 10.7% |
| Immigrants | Ethiopia | 100.0 /100 | #34 | Exceptional 10.7% |
| Immigrants | Indonesia | 100.0 /100 | #35 | Exceptional 10.7% |
| Ethiopians | 100.0 /100 | #36 | Exceptional 10.7% |
| Turks | 100.0 /100 | #37 | Exceptional 10.7% |
| Afghans | 99.9 /100 | #38 | Exceptional 10.8% |
| Cambodians | 99.9 /100 | #39 | Exceptional 10.8% |
| Mongolians | 99.9 /100 | #40 | Exceptional 10.8% |
| Immigrants | Australia | 99.9 /100 | #41 | Exceptional 10.8% |
| Immigrants | Nepal | 99.9 /100 | #42 | Exceptional 10.8% |
| Israelis | 99.9 /100 | #43 | Exceptional 10.8% |
| Immigrants | Japan | 99.9 /100 | #44 | Exceptional 10.8% |
| Immigrants | Peru | 99.9 /100 | #45 | Exceptional 10.8% |
| Tongans | 99.9 /100 | #46 | Exceptional 10.8% |
| Taiwanese | 99.9 /100 | #47 | Exceptional 10.8% |