Sri Lankan vs Mongolian Disability
COMPARE
Sri Lankan
Mongolian
Disability
Disability Comparison
Sri Lankans
Mongolians
11.0%
DISABILITY
99.5/ 100
METRIC RATING
69th/ 347
METRIC RANK
10.8%
DISABILITY
99.9/ 100
METRIC RATING
40th/ 347
METRIC RANK
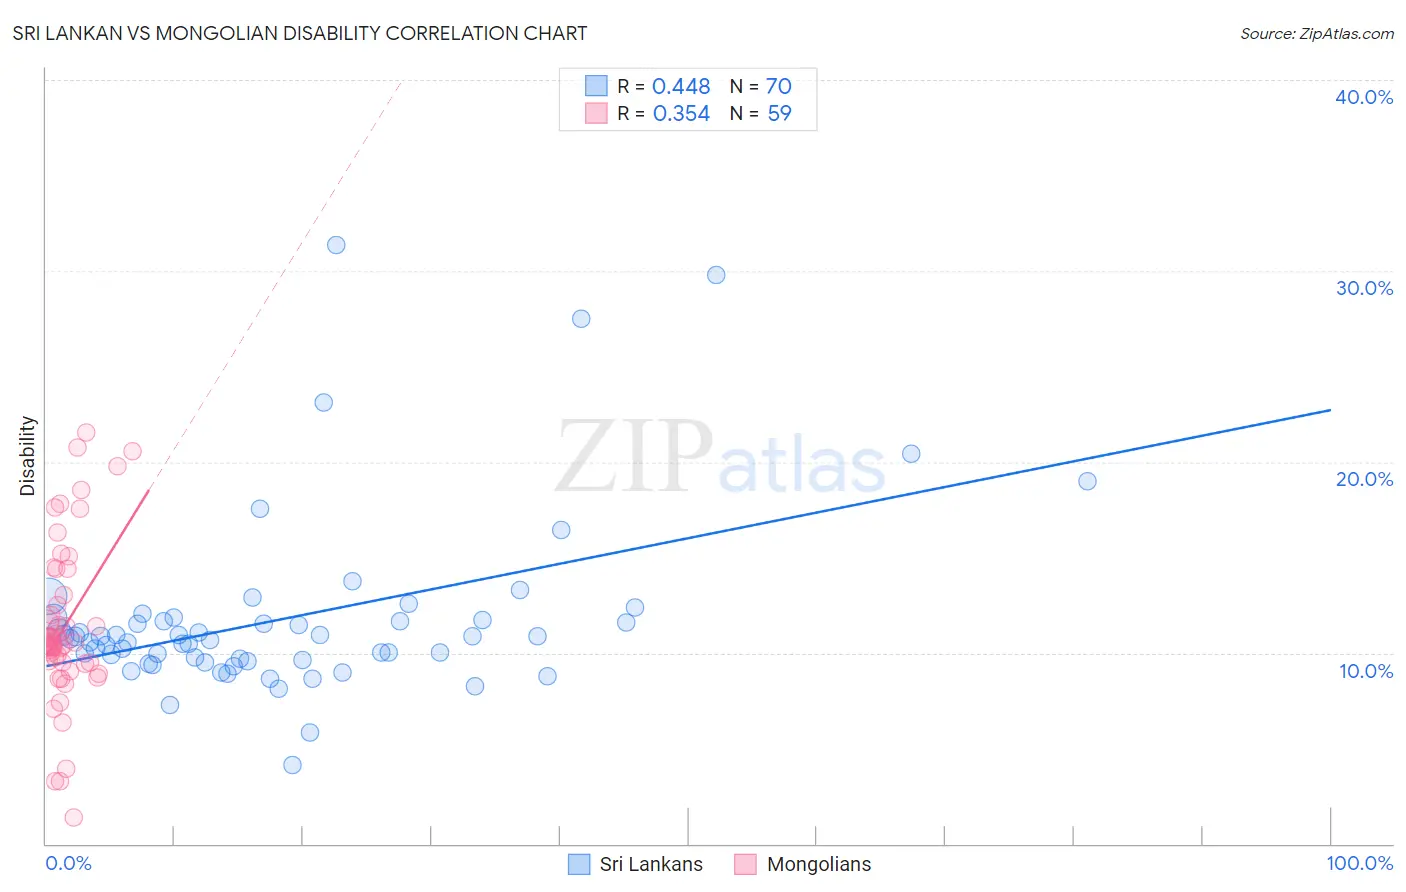
Sri Lankan vs Mongolian Disability Correlation Chart
The statistical analysis conducted on geographies consisting of 440,510,650 people shows a moderate positive correlation between the proportion of Sri Lankans and percentage of population with a disability in the United States with a correlation coefficient (R) of 0.448 and weighted average of 11.0%. Similarly, the statistical analysis conducted on geographies consisting of 140,360,971 people shows a mild positive correlation between the proportion of Mongolians and percentage of population with a disability in the United States with a correlation coefficient (R) of 0.354 and weighted average of 10.8%, a difference of 2.4%.
Disability Correlation Summary
| Measurement | Sri Lankan | Mongolian |
| Minimum | 4.1% | 1.4% |
| Maximum | 31.3% | 21.6% |
| Range | 27.2% | 20.2% |
| Mean | 11.8% | 11.3% |
| Median | 10.8% | 10.5% |
| Interquartile 25% (IQ1) | 9.6% | 9.5% |
| Interquartile 75% (IQ3) | 11.7% | 13.0% |
| Interquartile Range (IQR) | 2.1% | 3.5% |
| Standard Deviation (Sample) | 4.8% | 4.2% |
| Standard Deviation (Population) | 4.7% | 4.2% |
Similar Demographics by Disability
Demographics Similar to Sri Lankans by Disability
In terms of disability, the demographic groups most similar to Sri Lankans are Immigrants from France (11.0%, a difference of 0.080%), Immigrants from Lebanon (11.0%, a difference of 0.090%), Immigrants from Chile (11.0%, a difference of 0.18%), Immigrants from Afghanistan (11.0%, a difference of 0.21%), and Immigrants from Bangladesh (11.0%, a difference of 0.21%).
| Demographics | Rating | Rank | Disability |
| Immigrants | Northern Africa | 99.7 /100 | #62 | Exceptional 10.9% |
| Immigrants | Eritrea | 99.7 /100 | #63 | Exceptional 11.0% |
| Immigrants | Sweden | 99.6 /100 | #64 | Exceptional 11.0% |
| Bulgarians | 99.6 /100 | #65 | Exceptional 11.0% |
| Laotians | 99.6 /100 | #66 | Exceptional 11.0% |
| Colombians | 99.6 /100 | #67 | Exceptional 11.0% |
| Immigrants | Afghanistan | 99.6 /100 | #68 | Exceptional 11.0% |
| Sri Lankans | 99.5 /100 | #69 | Exceptional 11.0% |
| Immigrants | France | 99.4 /100 | #70 | Exceptional 11.0% |
| Immigrants | Lebanon | 99.4 /100 | #71 | Exceptional 11.0% |
| Immigrants | Chile | 99.4 /100 | #72 | Exceptional 11.0% |
| Immigrants | Bangladesh | 99.4 /100 | #73 | Exceptional 11.0% |
| Immigrants | Serbia | 99.4 /100 | #74 | Exceptional 11.0% |
| Immigrants | Vietnam | 99.4 /100 | #75 | Exceptional 11.0% |
| Sierra Leoneans | 99.3 /100 | #76 | Exceptional 11.0% |
Demographics Similar to Mongolians by Disability
In terms of disability, the demographic groups most similar to Mongolians are Cambodian (10.8%, a difference of 0.0%), Immigrants from Australia (10.8%, a difference of 0.040%), Afghan (10.8%, a difference of 0.10%), Immigrants from Nepal (10.8%, a difference of 0.14%), and Israeli (10.8%, a difference of 0.19%).
| Demographics | Rating | Rank | Disability |
| Immigrants | Kuwait | 100.0 /100 | #33 | Exceptional 10.7% |
| Immigrants | Ethiopia | 100.0 /100 | #34 | Exceptional 10.7% |
| Immigrants | Indonesia | 100.0 /100 | #35 | Exceptional 10.7% |
| Ethiopians | 100.0 /100 | #36 | Exceptional 10.7% |
| Turks | 100.0 /100 | #37 | Exceptional 10.7% |
| Afghans | 99.9 /100 | #38 | Exceptional 10.8% |
| Cambodians | 99.9 /100 | #39 | Exceptional 10.8% |
| Mongolians | 99.9 /100 | #40 | Exceptional 10.8% |
| Immigrants | Australia | 99.9 /100 | #41 | Exceptional 10.8% |
| Immigrants | Nepal | 99.9 /100 | #42 | Exceptional 10.8% |
| Israelis | 99.9 /100 | #43 | Exceptional 10.8% |
| Immigrants | Japan | 99.9 /100 | #44 | Exceptional 10.8% |
| Immigrants | Peru | 99.9 /100 | #45 | Exceptional 10.8% |
| Tongans | 99.9 /100 | #46 | Exceptional 10.8% |
| Taiwanese | 99.9 /100 | #47 | Exceptional 10.8% |