Armenian vs Immigrants from Ireland Vision Disability
COMPARE
Armenian
Immigrants from Ireland
Vision Disability
Vision Disability Comparison
Armenians
Immigrants from Ireland
2.0%
VISION DISABILITY
99.0/ 100
METRIC RATING
63rd/ 347
METRIC RANK
2.0%
VISION DISABILITY
99.7/ 100
METRIC RATING
40th/ 347
METRIC RANK
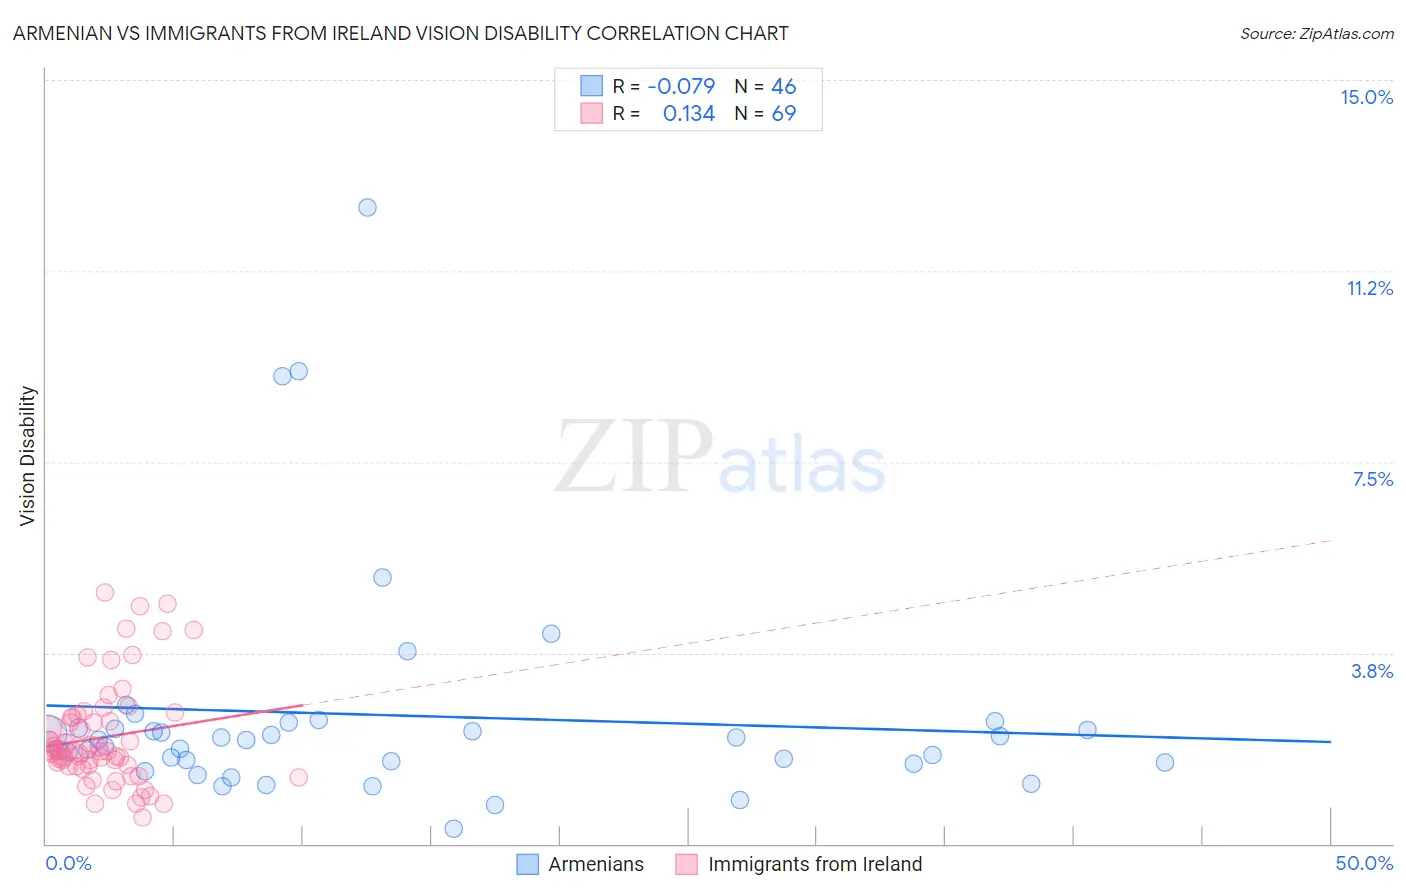
Armenian vs Immigrants from Ireland Vision Disability Correlation Chart
The statistical analysis conducted on geographies consisting of 310,763,377 people shows a slight negative correlation between the proportion of Armenians and percentage of population with vision disability in the United States with a correlation coefficient (R) of -0.079 and weighted average of 2.0%. Similarly, the statistical analysis conducted on geographies consisting of 240,640,938 people shows a poor positive correlation between the proportion of Immigrants from Ireland and percentage of population with vision disability in the United States with a correlation coefficient (R) of 0.134 and weighted average of 2.0%, a difference of 2.1%.
Vision Disability Correlation Summary
| Measurement | Armenian | Immigrants from Ireland |
| Minimum | 0.29% | 0.52% |
| Maximum | 12.5% | 4.9% |
| Range | 12.2% | 4.4% |
| Mean | 2.5% | 2.1% |
| Median | 2.0% | 1.8% |
| Interquartile 25% (IQ1) | 1.6% | 1.5% |
| Interquartile 75% (IQ3) | 2.3% | 2.5% |
| Interquartile Range (IQR) | 0.68% | 0.95% |
| Standard Deviation (Sample) | 2.3% | 0.99% |
| Standard Deviation (Population) | 2.3% | 0.98% |
Similar Demographics by Vision Disability
Demographics Similar to Armenians by Vision Disability
In terms of vision disability, the demographic groups most similar to Armenians are Immigrants from Russia (2.0%, a difference of 0.11%), Immigrants from Belgium (2.0%, a difference of 0.13%), Immigrants from Greece (2.0%, a difference of 0.13%), Immigrants from Romania (2.0%, a difference of 0.15%), and Argentinean (2.0%, a difference of 0.17%).
| Demographics | Rating | Rank | Vision Disability |
| Jordanians | 99.2 /100 | #56 | Exceptional 2.0% |
| Somalis | 99.2 /100 | #57 | Exceptional 2.0% |
| Immigrants | Saudi Arabia | 99.2 /100 | #58 | Exceptional 2.0% |
| Argentineans | 99.1 /100 | #59 | Exceptional 2.0% |
| Immigrants | Romania | 99.1 /100 | #60 | Exceptional 2.0% |
| Immigrants | Belgium | 99.1 /100 | #61 | Exceptional 2.0% |
| Immigrants | Russia | 99.1 /100 | #62 | Exceptional 2.0% |
| Armenians | 99.0 /100 | #63 | Exceptional 2.0% |
| Immigrants | Greece | 99.0 /100 | #64 | Exceptional 2.0% |
| Maltese | 98.9 /100 | #65 | Exceptional 2.0% |
| Immigrants | Argentina | 98.9 /100 | #66 | Exceptional 2.0% |
| Immigrants | Northern Africa | 98.8 /100 | #67 | Exceptional 2.0% |
| Immigrants | Czechoslovakia | 98.7 /100 | #68 | Exceptional 2.0% |
| Russians | 98.6 /100 | #69 | Exceptional 2.0% |
| Immigrants | Kazakhstan | 98.6 /100 | #70 | Exceptional 2.0% |
Demographics Similar to Immigrants from Ireland by Vision Disability
In terms of vision disability, the demographic groups most similar to Immigrants from Ireland are Cypriot (2.0%, a difference of 0.030%), Immigrants from Ethiopia (2.0%, a difference of 0.18%), Zimbabwean (2.0%, a difference of 0.20%), Eastern European (2.0%, a difference of 0.24%), and Immigrants from Kuwait (2.0%, a difference of 0.26%).
| Demographics | Rating | Rank | Vision Disability |
| Immigrants | Egypt | 99.9 /100 | #33 | Exceptional 1.9% |
| Immigrants | Turkey | 99.8 /100 | #34 | Exceptional 1.9% |
| Immigrants | Australia | 99.8 /100 | #35 | Exceptional 1.9% |
| Cambodians | 99.8 /100 | #36 | Exceptional 2.0% |
| Bhutanese | 99.8 /100 | #37 | Exceptional 2.0% |
| Immigrants | Kuwait | 99.8 /100 | #38 | Exceptional 2.0% |
| Zimbabweans | 99.7 /100 | #39 | Exceptional 2.0% |
| Immigrants | Ireland | 99.7 /100 | #40 | Exceptional 2.0% |
| Cypriots | 99.7 /100 | #41 | Exceptional 2.0% |
| Immigrants | Ethiopia | 99.7 /100 | #42 | Exceptional 2.0% |
| Eastern Europeans | 99.7 /100 | #43 | Exceptional 2.0% |
| Immigrants | Indonesia | 99.7 /100 | #44 | Exceptional 2.0% |
| Ethiopians | 99.7 /100 | #45 | Exceptional 2.0% |
| Immigrants | Sweden | 99.7 /100 | #46 | Exceptional 2.0% |
| Immigrants | Bulgaria | 99.7 /100 | #47 | Exceptional 2.0% |