Subsaharan African vs Immigrants from El Salvador Self-Care Disability
COMPARE
Subsaharan African
Immigrants from El Salvador
Self-Care Disability
Self-Care Disability Comparison
Sub-Saharan Africans
Immigrants from El Salvador
2.6%
SELF-CARE DISABILITY
4.0/ 100
METRIC RATING
220th/ 347
METRIC RANK
2.5%
SELF-CARE DISABILITY
33.0/ 100
METRIC RATING
186th/ 347
METRIC RANK
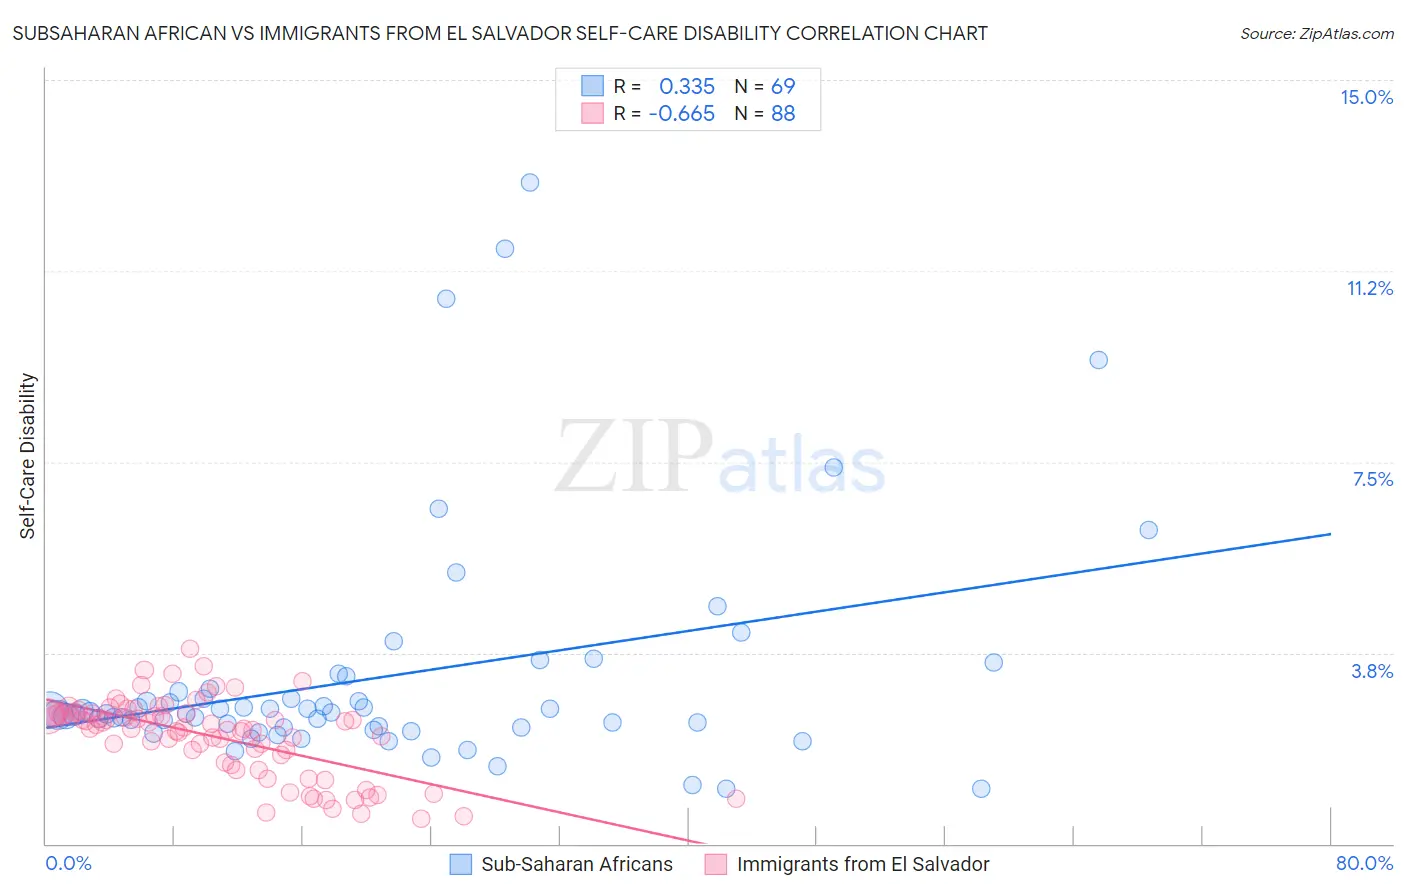
Subsaharan African vs Immigrants from El Salvador Self-Care Disability Correlation Chart
The statistical analysis conducted on geographies consisting of 507,052,874 people shows a mild positive correlation between the proportion of Sub-Saharan Africans and percentage of population with self-care disability in the United States with a correlation coefficient (R) of 0.335 and weighted average of 2.6%. Similarly, the statistical analysis conducted on geographies consisting of 357,509,319 people shows a significant negative correlation between the proportion of Immigrants from El Salvador and percentage of population with self-care disability in the United States with a correlation coefficient (R) of -0.665 and weighted average of 2.5%, a difference of 2.9%.
Self-Care Disability Correlation Summary
| Measurement | Subsaharan African | Immigrants from El Salvador |
| Minimum | 1.1% | 0.49% |
| Maximum | 13.0% | 3.8% |
| Range | 11.9% | 3.3% |
| Mean | 3.3% | 2.1% |
| Median | 2.6% | 2.3% |
| Interquartile 25% (IQ1) | 2.3% | 1.7% |
| Interquartile 75% (IQ3) | 3.0% | 2.6% |
| Interquartile Range (IQR) | 0.74% | 0.89% |
| Standard Deviation (Sample) | 2.3% | 0.76% |
| Standard Deviation (Population) | 2.3% | 0.75% |
Similar Demographics by Self-Care Disability
Demographics Similar to Sub-Saharan Africans by Self-Care Disability
In terms of self-care disability, the demographic groups most similar to Sub-Saharan Africans are Immigrants from Moldova (2.6%, a difference of 0.010%), Scotch-Irish (2.6%, a difference of 0.040%), Honduran (2.6%, a difference of 0.040%), Spaniard (2.6%, a difference of 0.050%), and French Canadian (2.6%, a difference of 0.050%).
| Demographics | Rating | Rank | Self-Care Disability |
| Ecuadorians | 4.7 /100 | #213 | Tragic 2.6% |
| Immigrants | Honduras | 4.7 /100 | #214 | Tragic 2.6% |
| Immigrants | Thailand | 4.5 /100 | #215 | Tragic 2.6% |
| Whites/Caucasians | 4.4 /100 | #216 | Tragic 2.6% |
| Celtics | 4.4 /100 | #217 | Tragic 2.6% |
| Scotch-Irish | 4.1 /100 | #218 | Tragic 2.6% |
| Immigrants | Moldova | 4.0 /100 | #219 | Tragic 2.6% |
| Sub-Saharan Africans | 4.0 /100 | #220 | Tragic 2.6% |
| Hondurans | 3.8 /100 | #221 | Tragic 2.6% |
| Spaniards | 3.8 /100 | #222 | Tragic 2.6% |
| French Canadians | 3.8 /100 | #223 | Tragic 2.6% |
| Osage | 3.6 /100 | #224 | Tragic 2.6% |
| Iraqis | 3.2 /100 | #225 | Tragic 2.6% |
| Chinese | 2.9 /100 | #226 | Tragic 2.6% |
| Immigrants | Philippines | 2.7 /100 | #227 | Tragic 2.6% |
Demographics Similar to Immigrants from El Salvador by Self-Care Disability
In terms of self-care disability, the demographic groups most similar to Immigrants from El Salvador are Slavic (2.5%, a difference of 0.070%), Yugoslavian (2.5%, a difference of 0.17%), Salvadoran (2.5%, a difference of 0.18%), Maltese (2.5%, a difference of 0.23%), and Irish (2.5%, a difference of 0.23%).
| Demographics | Rating | Rank | Self-Care Disability |
| Hungarians | 45.5 /100 | #179 | Average 2.5% |
| Indonesians | 41.2 /100 | #180 | Average 2.5% |
| Ghanaians | 40.4 /100 | #181 | Average 2.5% |
| Maltese | 37.5 /100 | #182 | Fair 2.5% |
| Salvadorans | 36.4 /100 | #183 | Fair 2.5% |
| Yugoslavians | 36.1 /100 | #184 | Fair 2.5% |
| Slavs | 34.3 /100 | #185 | Fair 2.5% |
| Immigrants | El Salvador | 33.0 /100 | #186 | Fair 2.5% |
| Irish | 28.7 /100 | #187 | Fair 2.5% |
| Immigrants | Oceania | 28.3 /100 | #188 | Fair 2.5% |
| Immigrants | Eastern Europe | 28.0 /100 | #189 | Fair 2.5% |
| Sioux | 24.6 /100 | #190 | Fair 2.5% |
| Moroccans | 22.9 /100 | #191 | Fair 2.5% |
| Soviet Union | 22.2 /100 | #192 | Fair 2.5% |
| Ukrainians | 21.4 /100 | #193 | Fair 2.5% |