Subsaharan African vs Native/Alaskan Self-Care Disability
COMPARE
Subsaharan African
Native/Alaskan
Self-Care Disability
Self-Care Disability Comparison
Sub-Saharan Africans
Natives/Alaskans
2.6%
SELF-CARE DISABILITY
4.0/ 100
METRIC RATING
220th/ 347
METRIC RANK
2.8%
SELF-CARE DISABILITY
0.0/ 100
METRIC RATING
307th/ 347
METRIC RANK
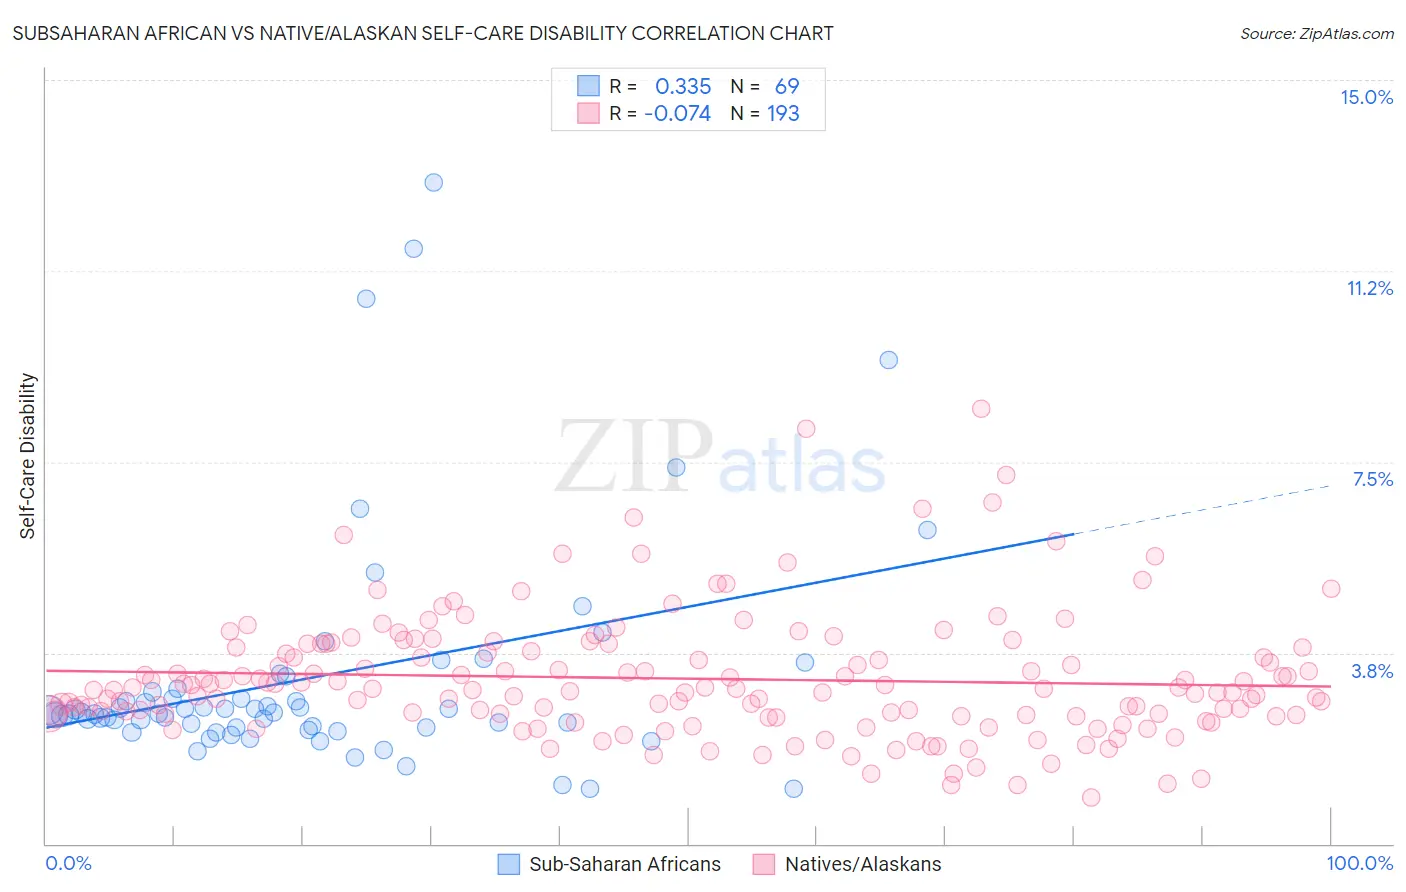
Subsaharan African vs Native/Alaskan Self-Care Disability Correlation Chart
The statistical analysis conducted on geographies consisting of 507,052,874 people shows a mild positive correlation between the proportion of Sub-Saharan Africans and percentage of population with self-care disability in the United States with a correlation coefficient (R) of 0.335 and weighted average of 2.6%. Similarly, the statistical analysis conducted on geographies consisting of 511,798,429 people shows a slight negative correlation between the proportion of Natives/Alaskans and percentage of population with self-care disability in the United States with a correlation coefficient (R) of -0.074 and weighted average of 2.8%, a difference of 9.6%.
Self-Care Disability Correlation Summary
| Measurement | Subsaharan African | Native/Alaskan |
| Minimum | 1.1% | 0.90% |
| Maximum | 13.0% | 8.5% |
| Range | 11.9% | 7.7% |
| Mean | 3.3% | 3.2% |
| Median | 2.6% | 3.0% |
| Interquartile 25% (IQ1) | 2.3% | 2.5% |
| Interquartile 75% (IQ3) | 3.0% | 3.9% |
| Interquartile Range (IQR) | 0.74% | 1.3% |
| Standard Deviation (Sample) | 2.3% | 1.2% |
| Standard Deviation (Population) | 2.3% | 1.2% |
Similar Demographics by Self-Care Disability
Demographics Similar to Sub-Saharan Africans by Self-Care Disability
In terms of self-care disability, the demographic groups most similar to Sub-Saharan Africans are Immigrants from Moldova (2.6%, a difference of 0.010%), Scotch-Irish (2.6%, a difference of 0.040%), Honduran (2.6%, a difference of 0.040%), Spaniard (2.6%, a difference of 0.050%), and French Canadian (2.6%, a difference of 0.050%).
| Demographics | Rating | Rank | Self-Care Disability |
| Ecuadorians | 4.7 /100 | #213 | Tragic 2.6% |
| Immigrants | Honduras | 4.7 /100 | #214 | Tragic 2.6% |
| Immigrants | Thailand | 4.5 /100 | #215 | Tragic 2.6% |
| Whites/Caucasians | 4.4 /100 | #216 | Tragic 2.6% |
| Celtics | 4.4 /100 | #217 | Tragic 2.6% |
| Scotch-Irish | 4.1 /100 | #218 | Tragic 2.6% |
| Immigrants | Moldova | 4.0 /100 | #219 | Tragic 2.6% |
| Sub-Saharan Africans | 4.0 /100 | #220 | Tragic 2.6% |
| Hondurans | 3.8 /100 | #221 | Tragic 2.6% |
| Spaniards | 3.8 /100 | #222 | Tragic 2.6% |
| French Canadians | 3.8 /100 | #223 | Tragic 2.6% |
| Osage | 3.6 /100 | #224 | Tragic 2.6% |
| Iraqis | 3.2 /100 | #225 | Tragic 2.6% |
| Chinese | 2.9 /100 | #226 | Tragic 2.6% |
| Immigrants | Philippines | 2.7 /100 | #227 | Tragic 2.6% |
Demographics Similar to Natives/Alaskans by Self-Care Disability
In terms of self-care disability, the demographic groups most similar to Natives/Alaskans are Aleut (2.8%, a difference of 0.070%), Immigrants from Grenada (2.8%, a difference of 0.30%), Bangladeshi (2.8%, a difference of 0.45%), Immigrants from West Indies (2.8%, a difference of 0.47%), and Cree (2.8%, a difference of 0.52%).
| Demographics | Rating | Rank | Self-Care Disability |
| Immigrants | Fiji | 0.0 /100 | #300 | Tragic 2.8% |
| Pima | 0.0 /100 | #301 | Tragic 2.8% |
| Immigrants | St. Vincent and the Grenadines | 0.0 /100 | #302 | Tragic 2.8% |
| Immigrants | Belize | 0.0 /100 | #303 | Tragic 2.8% |
| Cree | 0.0 /100 | #304 | Tragic 2.8% |
| Immigrants | West Indies | 0.0 /100 | #305 | Tragic 2.8% |
| Aleuts | 0.0 /100 | #306 | Tragic 2.8% |
| Natives/Alaskans | 0.0 /100 | #307 | Tragic 2.8% |
| Immigrants | Grenada | 0.0 /100 | #308 | Tragic 2.8% |
| Bangladeshis | 0.0 /100 | #309 | Tragic 2.8% |
| British West Indians | 0.0 /100 | #310 | Tragic 2.8% |
| Puget Sound Salish | 0.0 /100 | #311 | Tragic 2.8% |
| Immigrants | Caribbean | 0.0 /100 | #312 | Tragic 2.8% |
| Spanish Americans | 0.0 /100 | #313 | Tragic 2.8% |
| Creek | 0.0 /100 | #314 | Tragic 2.8% |