Subsaharan African vs Immigrants from Eastern Europe Disability Age 5 to 17
COMPARE
Subsaharan African
Immigrants from Eastern Europe
Disability Age 5 to 17
Disability Age 5 to 17 Comparison
Sub-Saharan Africans
Immigrants from Eastern Europe
6.2%
DISABILITY AGE 5 TO 17
0.0/ 100
METRIC RATING
284th/ 347
METRIC RANK
5.1%
DISABILITY AGE 5 TO 17
99.9/ 100
METRIC RATING
60th/ 347
METRIC RANK
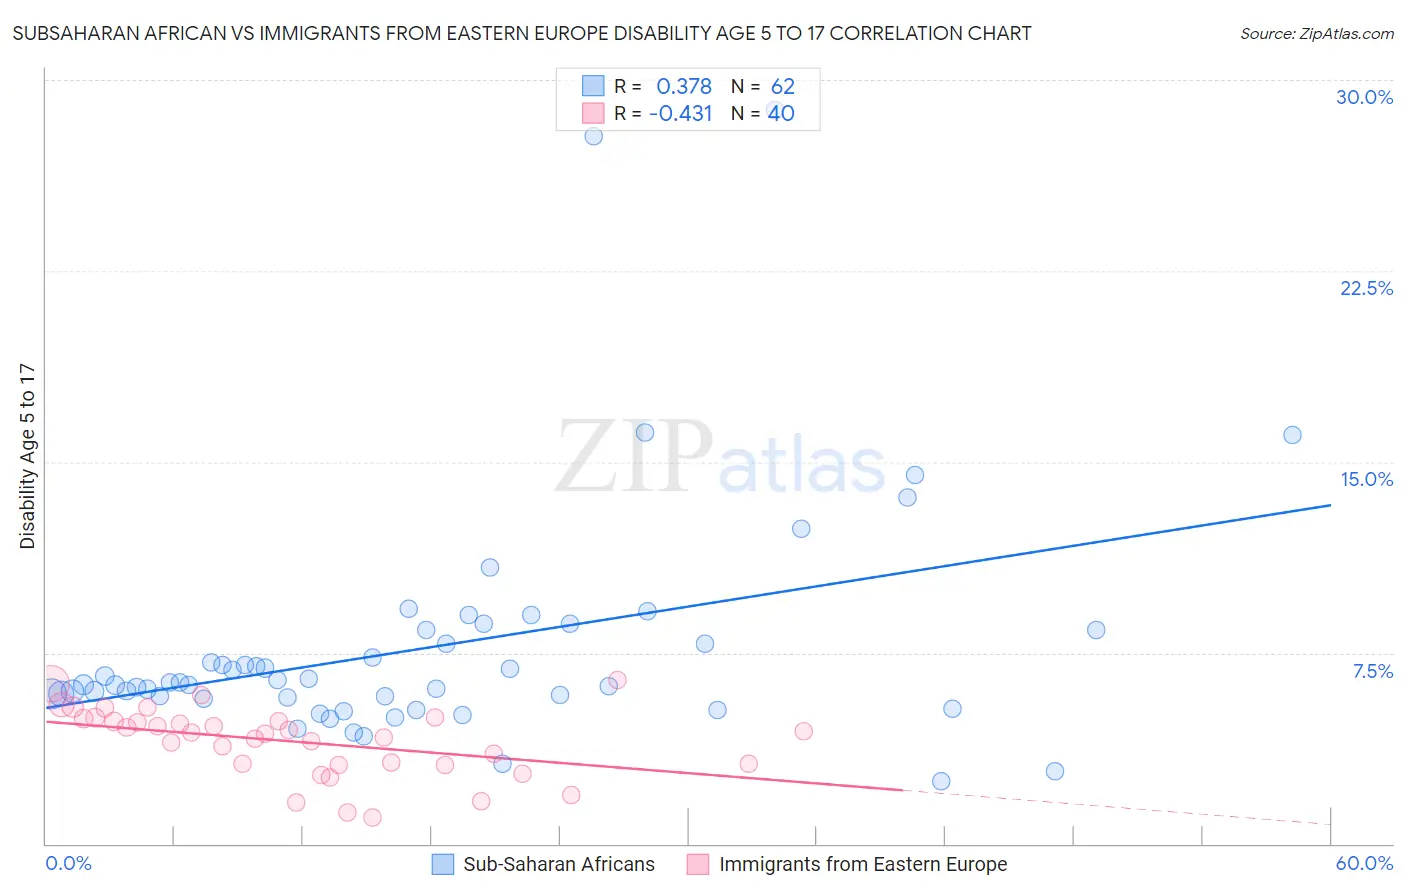
Subsaharan African vs Immigrants from Eastern Europe Disability Age 5 to 17 Correlation Chart
The statistical analysis conducted on geographies consisting of 502,132,058 people shows a mild positive correlation between the proportion of Sub-Saharan Africans and percentage of population with a disability between the ages 5 and 17 in the United States with a correlation coefficient (R) of 0.378 and weighted average of 6.2%. Similarly, the statistical analysis conducted on geographies consisting of 469,560,483 people shows a moderate negative correlation between the proportion of Immigrants from Eastern Europe and percentage of population with a disability between the ages 5 and 17 in the United States with a correlation coefficient (R) of -0.431 and weighted average of 5.1%, a difference of 19.8%.
Disability Age 5 to 17 Correlation Summary
| Measurement | Subsaharan African | Immigrants from Eastern Europe |
| Minimum | 2.5% | 1.0% |
| Maximum | 28.8% | 6.4% |
| Range | 26.3% | 5.4% |
| Mean | 7.7% | 4.0% |
| Median | 6.3% | 4.4% |
| Interquartile 25% (IQ1) | 5.7% | 3.1% |
| Interquartile 75% (IQ3) | 8.4% | 4.9% |
| Interquartile Range (IQR) | 2.7% | 1.7% |
| Standard Deviation (Sample) | 4.7% | 1.3% |
| Standard Deviation (Population) | 4.6% | 1.3% |
Similar Demographics by Disability Age 5 to 17
Demographics Similar to Sub-Saharan Africans by Disability Age 5 to 17
In terms of disability age 5 to 17, the demographic groups most similar to Sub-Saharan Africans are English (6.2%, a difference of 0.0%), Ugandan (6.2%, a difference of 0.030%), Colville (6.2%, a difference of 0.040%), German (6.1%, a difference of 0.19%), and Pima (6.2%, a difference of 0.23%).
| Demographics | Rating | Rank | Disability Age 5 to 17 |
| Puget Sound Salish | 0.1 /100 | #277 | Tragic 6.1% |
| Immigrants | Liberia | 0.1 /100 | #278 | Tragic 6.1% |
| Immigrants | Jamaica | 0.1 /100 | #279 | Tragic 6.1% |
| Portuguese | 0.1 /100 | #280 | Tragic 6.1% |
| Scottish | 0.0 /100 | #281 | Tragic 6.1% |
| Germans | 0.0 /100 | #282 | Tragic 6.1% |
| Ugandans | 0.0 /100 | #283 | Tragic 6.2% |
| Sub-Saharan Africans | 0.0 /100 | #284 | Tragic 6.2% |
| English | 0.0 /100 | #285 | Tragic 6.2% |
| Colville | 0.0 /100 | #286 | Tragic 6.2% |
| Pima | 0.0 /100 | #287 | Tragic 6.2% |
| Jamaicans | 0.0 /100 | #288 | Tragic 6.2% |
| Yaqui | 0.0 /100 | #289 | Tragic 6.2% |
| Immigrants | Congo | 0.0 /100 | #290 | Tragic 6.2% |
| Whites/Caucasians | 0.0 /100 | #291 | Tragic 6.2% |
Demographics Similar to Immigrants from Eastern Europe by Disability Age 5 to 17
In terms of disability age 5 to 17, the demographic groups most similar to Immigrants from Eastern Europe are Immigrants from North Macedonia (5.1%, a difference of 0.11%), Immigrants from Ukraine (5.1%, a difference of 0.29%), Immigrants from Poland (5.1%, a difference of 0.38%), Immigrants from Switzerland (5.2%, a difference of 0.48%), and Immigrants from Turkey (5.1%, a difference of 0.52%).
| Demographics | Rating | Rank | Disability Age 5 to 17 |
| Immigrants | Lithuania | 99.9 /100 | #53 | Exceptional 5.1% |
| Paraguayans | 99.9 /100 | #54 | Exceptional 5.1% |
| Laotians | 99.9 /100 | #55 | Exceptional 5.1% |
| Immigrants | Turkey | 99.9 /100 | #56 | Exceptional 5.1% |
| Immigrants | Poland | 99.9 /100 | #57 | Exceptional 5.1% |
| Immigrants | Ukraine | 99.9 /100 | #58 | Exceptional 5.1% |
| Immigrants | North Macedonia | 99.9 /100 | #59 | Exceptional 5.1% |
| Immigrants | Eastern Europe | 99.9 /100 | #60 | Exceptional 5.1% |
| Immigrants | Switzerland | 99.8 /100 | #61 | Exceptional 5.2% |
| Immigrants | Ireland | 99.8 /100 | #62 | Exceptional 5.2% |
| Immigrants | Bangladesh | 99.8 /100 | #63 | Exceptional 5.2% |
| Immigrants | South Eastern Asia | 99.8 /100 | #64 | Exceptional 5.2% |
| Immigrants | Greece | 99.8 /100 | #65 | Exceptional 5.2% |
| Palestinians | 99.8 /100 | #66 | Exceptional 5.2% |
| Macedonians | 99.8 /100 | #67 | Exceptional 5.2% |