Subsaharan African vs Chilean 10th Grade
COMPARE
Subsaharan African
Chilean
10th Grade
10th Grade Comparison
Sub-Saharan Africans
Chileans
93.1%
10TH GRADE
4.7/ 100
METRIC RATING
234th/ 347
METRIC RANK
93.9%
10TH GRADE
70.2/ 100
METRIC RATING
159th/ 347
METRIC RANK
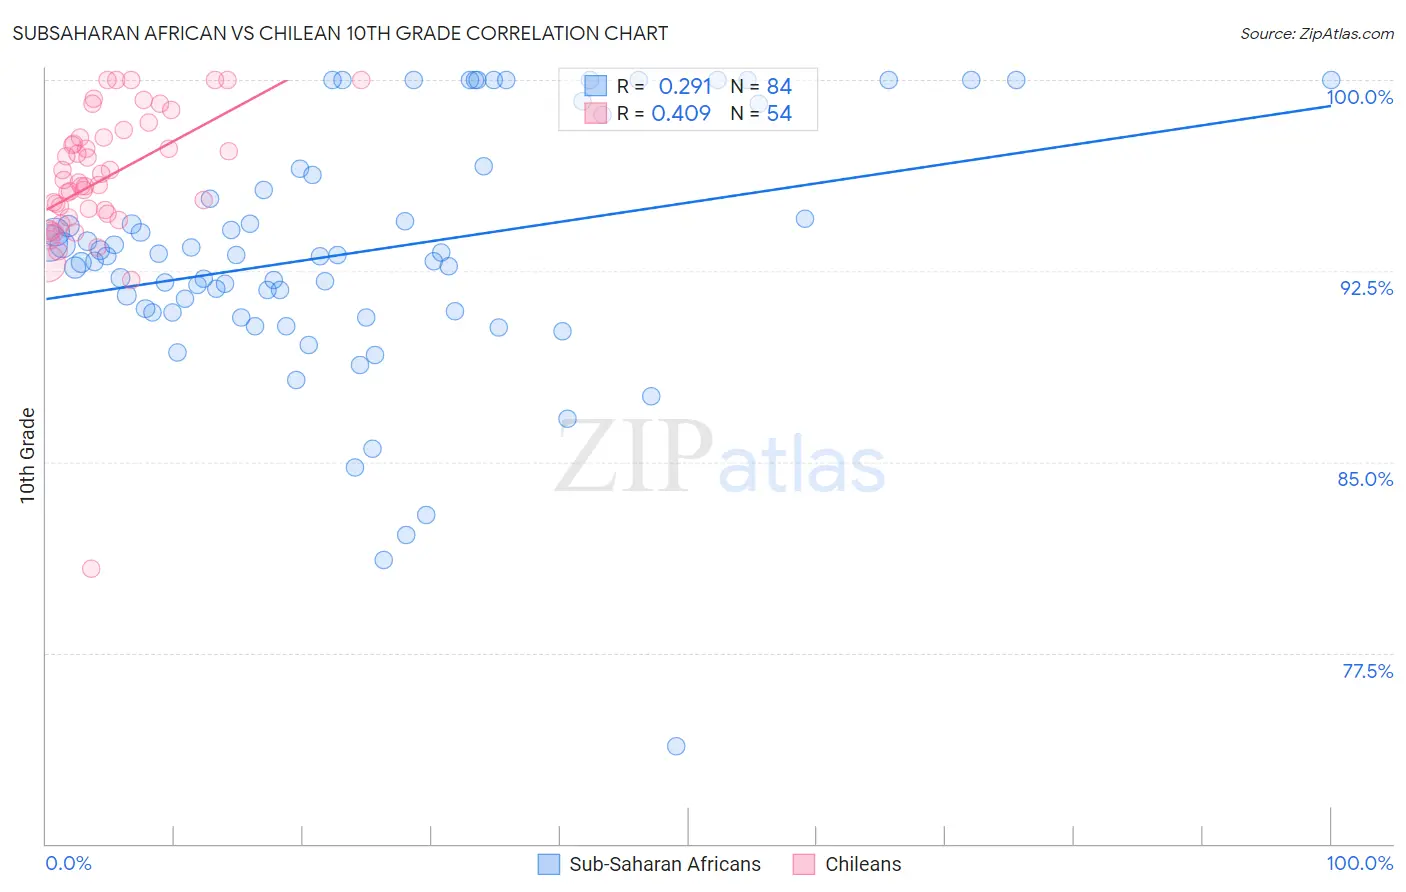
Subsaharan African vs Chilean 10th Grade Correlation Chart
The statistical analysis conducted on geographies consisting of 508,219,008 people shows a weak positive correlation between the proportion of Sub-Saharan Africans and percentage of population with at least 10th grade education in the United States with a correlation coefficient (R) of 0.291 and weighted average of 93.1%. Similarly, the statistical analysis conducted on geographies consisting of 256,683,580 people shows a moderate positive correlation between the proportion of Chileans and percentage of population with at least 10th grade education in the United States with a correlation coefficient (R) of 0.409 and weighted average of 93.9%, a difference of 0.87%.
10th Grade Correlation Summary
| Measurement | Subsaharan African | Chilean |
| Minimum | 73.8% | 80.8% |
| Maximum | 100.0% | 100.0% |
| Range | 26.2% | 19.2% |
| Mean | 93.3% | 96.1% |
| Median | 93.1% | 96.0% |
| Interquartile 25% (IQ1) | 90.9% | 94.7% |
| Interquartile 75% (IQ3) | 96.4% | 97.8% |
| Interquartile Range (IQR) | 5.5% | 3.0% |
| Standard Deviation (Sample) | 4.9% | 3.0% |
| Standard Deviation (Population) | 4.9% | 3.0% |
Similar Demographics by 10th Grade
Demographics Similar to Sub-Saharan Africans by 10th Grade
In terms of 10th grade, the demographic groups most similar to Sub-Saharan Africans are South American Indian (93.1%, a difference of 0.010%), Bahamian (93.1%, a difference of 0.010%), Comanche (93.1%, a difference of 0.010%), African (93.1%, a difference of 0.010%), and Afghan (93.1%, a difference of 0.010%).
| Demographics | Rating | Rank | 10th Grade |
| Blacks/African Americans | 6.0 /100 | #227 | Tragic 93.2% |
| Immigrants | China | 5.9 /100 | #228 | Tragic 93.2% |
| Immigrants | Ethiopia | 5.1 /100 | #229 | Tragic 93.1% |
| Immigrants | Africa | 5.0 /100 | #230 | Tragic 93.1% |
| South American Indians | 4.9 /100 | #231 | Tragic 93.1% |
| Bahamians | 4.9 /100 | #232 | Tragic 93.1% |
| Comanche | 4.9 /100 | #233 | Tragic 93.1% |
| Sub-Saharan Africans | 4.7 /100 | #234 | Tragic 93.1% |
| Africans | 4.6 /100 | #235 | Tragic 93.1% |
| Afghans | 4.5 /100 | #236 | Tragic 93.1% |
| Immigrants | Panama | 4.3 /100 | #237 | Tragic 93.1% |
| Nigerians | 4.2 /100 | #238 | Tragic 93.1% |
| Costa Ricans | 4.2 /100 | #239 | Tragic 93.1% |
| Immigrants | Hong Kong | 4.2 /100 | #240 | Tragic 93.1% |
| Immigrants | Somalia | 2.7 /100 | #241 | Tragic 93.0% |
Demographics Similar to Chileans by 10th Grade
In terms of 10th grade, the demographic groups most similar to Chileans are Pakistani (93.9%, a difference of 0.0%), Bermudan (93.9%, a difference of 0.010%), Assyrian/Chaldean/Syriac (93.9%, a difference of 0.010%), Immigrants from Poland (93.9%, a difference of 0.010%), and Venezuelan (93.9%, a difference of 0.010%).
| Demographics | Rating | Rank | 10th Grade |
| Immigrants | Italy | 78.0 /100 | #152 | Good 94.0% |
| Immigrants | Brazil | 75.5 /100 | #153 | Good 94.0% |
| Immigrants | Kenya | 75.3 /100 | #154 | Good 94.0% |
| Spanish | 74.9 /100 | #155 | Good 94.0% |
| Mongolians | 74.4 /100 | #156 | Good 94.0% |
| Kiowa | 73.3 /100 | #157 | Good 93.9% |
| Bermudans | 71.0 /100 | #158 | Good 93.9% |
| Chileans | 70.2 /100 | #159 | Good 93.9% |
| Pakistanis | 70.1 /100 | #160 | Good 93.9% |
| Assyrians/Chaldeans/Syriacs | 69.7 /100 | #161 | Good 93.9% |
| Immigrants | Poland | 69.6 /100 | #162 | Good 93.9% |
| Venezuelans | 69.5 /100 | #163 | Good 93.9% |
| Iraqis | 68.1 /100 | #164 | Good 93.9% |
| Brazilians | 63.6 /100 | #165 | Good 93.8% |
| Immigrants | Iraq | 63.0 /100 | #166 | Good 93.8% |