Spanish vs Immigrants from Haiti Vision Disability
COMPARE
Spanish
Immigrants from Haiti
Vision Disability
Vision Disability Comparison
Spanish
Immigrants from Haiti
2.4%
VISION DISABILITY
0.0/ 100
METRIC RATING
278th/ 347
METRIC RANK
2.4%
VISION DISABILITY
0.2/ 100
METRIC RATING
256th/ 347
METRIC RANK
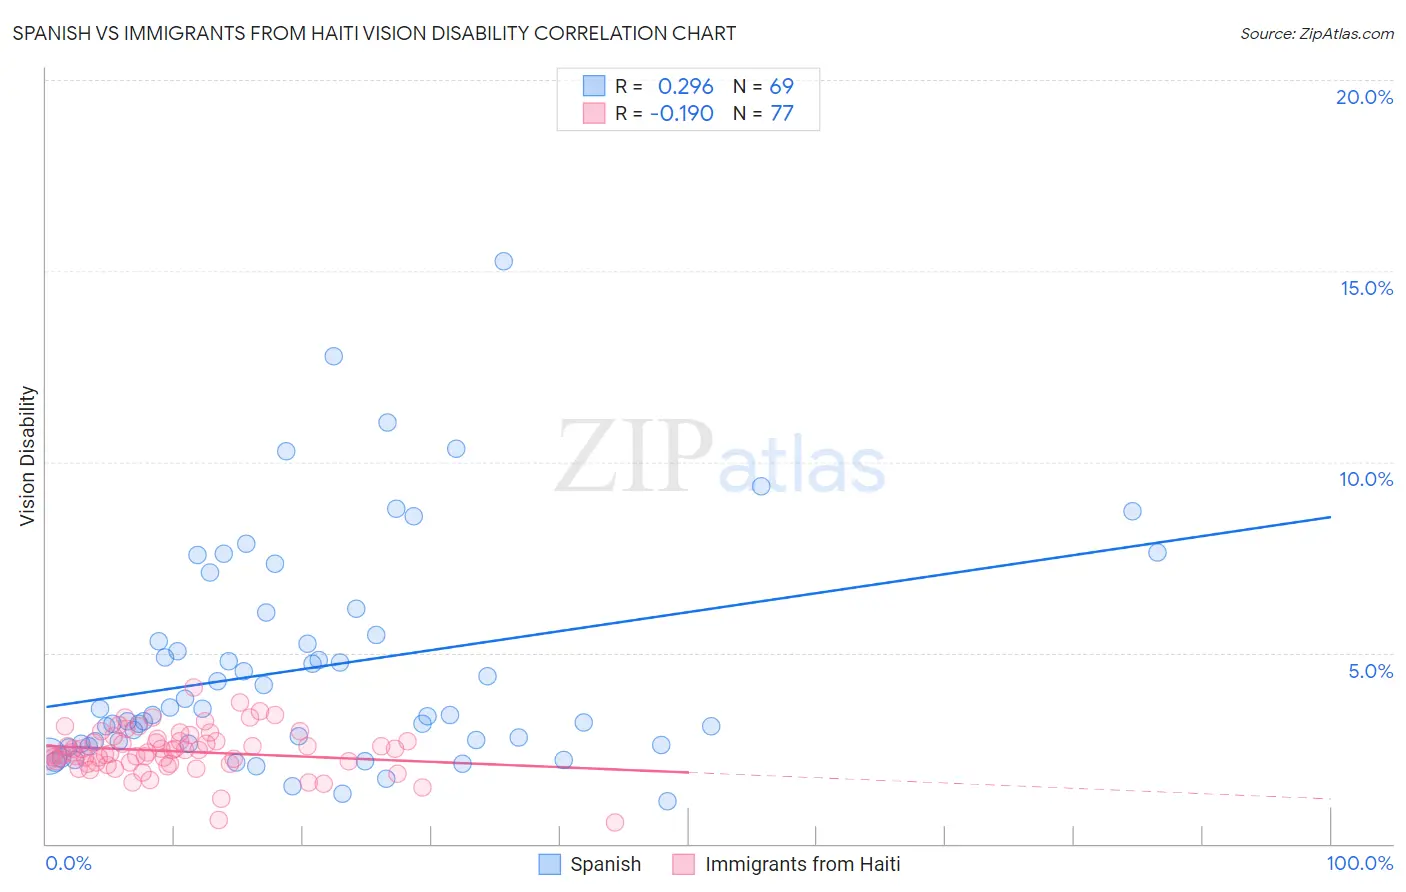
Spanish vs Immigrants from Haiti Vision Disability Correlation Chart
The statistical analysis conducted on geographies consisting of 421,761,942 people shows a weak positive correlation between the proportion of Spanish and percentage of population with vision disability in the United States with a correlation coefficient (R) of 0.296 and weighted average of 2.4%. Similarly, the statistical analysis conducted on geographies consisting of 225,143,301 people shows a poor negative correlation between the proportion of Immigrants from Haiti and percentage of population with vision disability in the United States with a correlation coefficient (R) of -0.190 and weighted average of 2.4%, a difference of 2.9%.
Vision Disability Correlation Summary
| Measurement | Spanish | Immigrants from Haiti |
| Minimum | 1.1% | 0.56% |
| Maximum | 15.3% | 4.1% |
| Range | 14.1% | 3.5% |
| Mean | 4.6% | 2.4% |
| Median | 3.4% | 2.4% |
| Interquartile 25% (IQ1) | 2.6% | 2.1% |
| Interquartile 75% (IQ3) | 5.8% | 2.7% |
| Interquartile Range (IQR) | 3.1% | 0.60% |
| Standard Deviation (Sample) | 2.9% | 0.60% |
| Standard Deviation (Population) | 2.9% | 0.60% |
Similar Demographics by Vision Disability
Demographics Similar to Spanish by Vision Disability
In terms of vision disability, the demographic groups most similar to Spanish are Nepalese (2.4%, a difference of 0.010%), Cape Verdean (2.4%, a difference of 0.050%), Bahamian (2.4%, a difference of 0.16%), Scotch-Irish (2.4%, a difference of 0.20%), and U.S. Virgin Islander (2.5%, a difference of 0.28%).
| Demographics | Rating | Rank | Vision Disability |
| Immigrants | Azores | 0.1 /100 | #271 | Tragic 2.4% |
| Spaniards | 0.1 /100 | #272 | Tragic 2.4% |
| Immigrants | Bahamas | 0.1 /100 | #273 | Tragic 2.4% |
| Immigrants | Latin America | 0.0 /100 | #274 | Tragic 2.4% |
| Chippewa | 0.0 /100 | #275 | Tragic 2.4% |
| Scotch-Irish | 0.0 /100 | #276 | Tragic 2.4% |
| Bahamians | 0.0 /100 | #277 | Tragic 2.4% |
| Spanish | 0.0 /100 | #278 | Tragic 2.4% |
| Nepalese | 0.0 /100 | #279 | Tragic 2.4% |
| Cape Verdeans | 0.0 /100 | #280 | Tragic 2.4% |
| U.S. Virgin Islanders | 0.0 /100 | #281 | Tragic 2.5% |
| Immigrants | Caribbean | 0.0 /100 | #282 | Tragic 2.5% |
| Puget Sound Salish | 0.0 /100 | #283 | Tragic 2.5% |
| Yakama | 0.0 /100 | #284 | Tragic 2.5% |
| Immigrants | Central America | 0.0 /100 | #285 | Tragic 2.5% |
Demographics Similar to Immigrants from Haiti by Vision Disability
In terms of vision disability, the demographic groups most similar to Immigrants from Haiti are West Indian (2.4%, a difference of 0.080%), British West Indian (2.4%, a difference of 0.10%), White/Caucasian (2.4%, a difference of 0.12%), Belizean (2.4%, a difference of 0.29%), and Immigrants from Guatemala (2.4%, a difference of 0.33%).
| Demographics | Rating | Rank | Vision Disability |
| Liberians | 0.5 /100 | #249 | Tragic 2.3% |
| Bangladeshis | 0.5 /100 | #250 | Tragic 2.3% |
| Immigrants | Laos | 0.4 /100 | #251 | Tragic 2.4% |
| Immigrants | Micronesia | 0.3 /100 | #252 | Tragic 2.4% |
| Japanese | 0.3 /100 | #253 | Tragic 2.4% |
| Haitians | 0.3 /100 | #254 | Tragic 2.4% |
| Immigrants | Guatemala | 0.3 /100 | #255 | Tragic 2.4% |
| Immigrants | Haiti | 0.2 /100 | #256 | Tragic 2.4% |
| West Indians | 0.2 /100 | #257 | Tragic 2.4% |
| British West Indians | 0.2 /100 | #258 | Tragic 2.4% |
| Whites/Caucasians | 0.2 /100 | #259 | Tragic 2.4% |
| Belizeans | 0.2 /100 | #260 | Tragic 2.4% |
| Fijians | 0.1 /100 | #261 | Tragic 2.4% |
| Jamaicans | 0.1 /100 | #262 | Tragic 2.4% |
| Immigrants | Belize | 0.1 /100 | #263 | Tragic 2.4% |