Spanish vs Immigrants from Yemen Ambulatory Disability
COMPARE
Spanish
Immigrants from Yemen
Ambulatory Disability
Ambulatory Disability Comparison
Spanish
Immigrants from Yemen
6.6%
AMBULATORY DISABILITY
0.2/ 100
METRIC RATING
268th/ 347
METRIC RANK
7.1%
AMBULATORY DISABILITY
0.0/ 100
METRIC RATING
313th/ 347
METRIC RANK
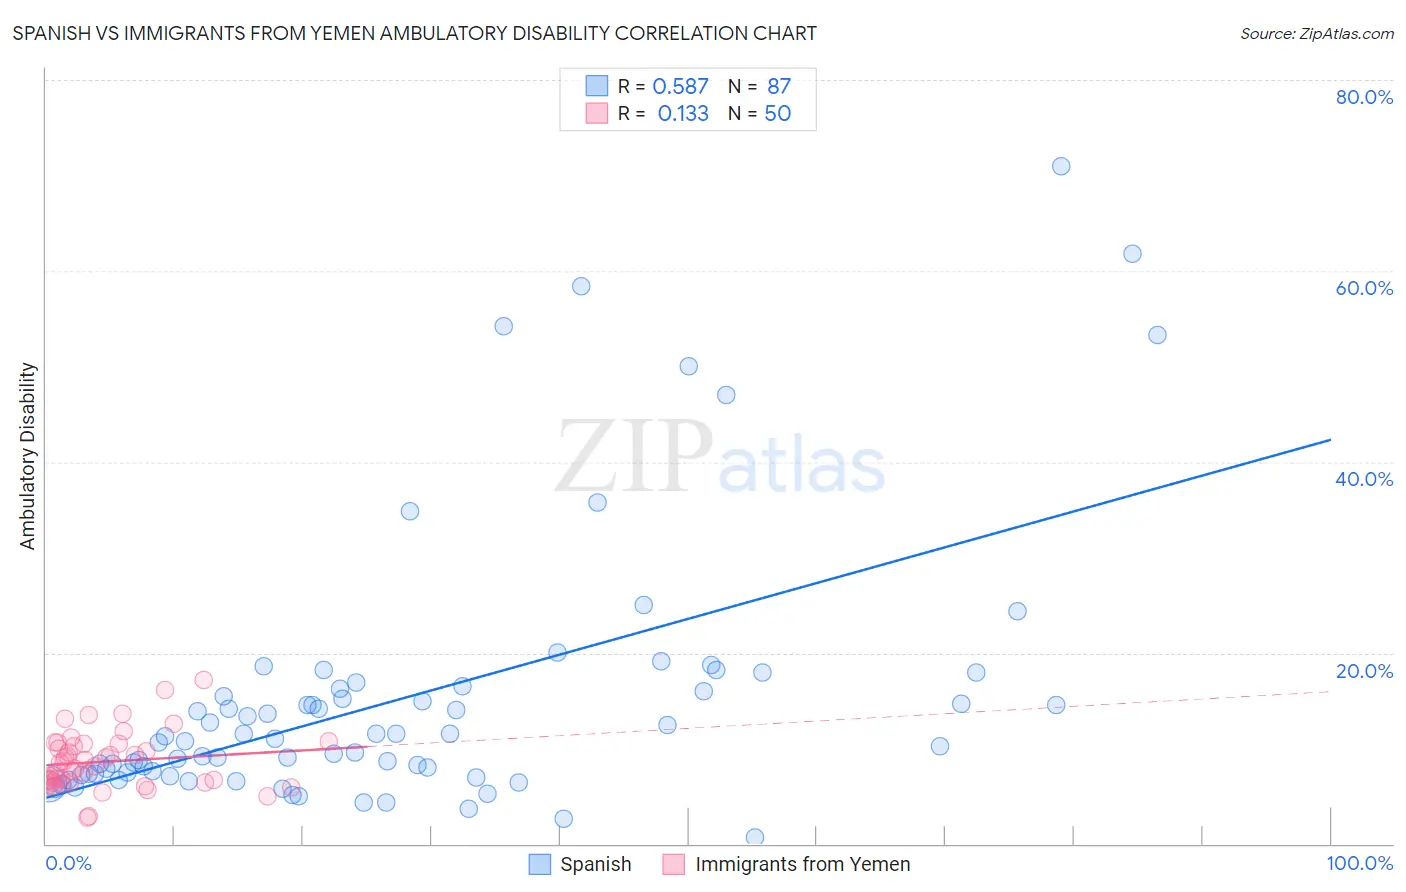
Spanish vs Immigrants from Yemen Ambulatory Disability Correlation Chart
The statistical analysis conducted on geographies consisting of 421,992,199 people shows a substantial positive correlation between the proportion of Spanish and percentage of population with ambulatory disability in the United States with a correlation coefficient (R) of 0.587 and weighted average of 6.6%. Similarly, the statistical analysis conducted on geographies consisting of 82,432,015 people shows a poor positive correlation between the proportion of Immigrants from Yemen and percentage of population with ambulatory disability in the United States with a correlation coefficient (R) of 0.133 and weighted average of 7.1%, a difference of 7.5%.
Ambulatory Disability Correlation Summary
| Measurement | Spanish | Immigrants from Yemen |
| Minimum | 0.68% | 2.8% |
| Maximum | 71.0% | 17.1% |
| Range | 70.3% | 14.4% |
| Mean | 15.1% | 8.6% |
| Median | 11.0% | 8.3% |
| Interquartile 25% (IQ1) | 7.3% | 6.4% |
| Interquartile 75% (IQ3) | 16.2% | 10.4% |
| Interquartile Range (IQR) | 8.9% | 4.0% |
| Standard Deviation (Sample) | 13.9% | 3.0% |
| Standard Deviation (Population) | 13.8% | 2.9% |
Similar Demographics by Ambulatory Disability
Demographics Similar to Spanish by Ambulatory Disability
In terms of ambulatory disability, the demographic groups most similar to Spanish are Trinidadian and Tobagonian (6.6%, a difference of 0.020%), Guyanese (6.6%, a difference of 0.14%), Bahamian (6.6%, a difference of 0.26%), French (6.6%, a difference of 0.31%), and Nepalese (6.6%, a difference of 0.33%).
| Demographics | Rating | Rank | Ambulatory Disability |
| Irish | 0.4 /100 | #261 | Tragic 6.6% |
| English | 0.4 /100 | #262 | Tragic 6.6% |
| Hmong | 0.3 /100 | #263 | Tragic 6.6% |
| Nepalese | 0.2 /100 | #264 | Tragic 6.6% |
| Bahamians | 0.2 /100 | #265 | Tragic 6.6% |
| Guyanese | 0.2 /100 | #266 | Tragic 6.6% |
| Trinidadians and Tobagonians | 0.2 /100 | #267 | Tragic 6.6% |
| Spanish | 0.2 /100 | #268 | Tragic 6.6% |
| French | 0.1 /100 | #269 | Tragic 6.6% |
| Slovaks | 0.1 /100 | #270 | Tragic 6.7% |
| Immigrants | Trinidad and Tobago | 0.1 /100 | #271 | Tragic 6.7% |
| French Canadians | 0.1 /100 | #272 | Tragic 6.7% |
| Whites/Caucasians | 0.1 /100 | #273 | Tragic 6.7% |
| Sioux | 0.1 /100 | #274 | Tragic 6.7% |
| Immigrants | Guyana | 0.1 /100 | #275 | Tragic 6.7% |
Demographics Similar to Immigrants from Yemen by Ambulatory Disability
In terms of ambulatory disability, the demographic groups most similar to Immigrants from Yemen are Blackfeet (7.1%, a difference of 0.020%), Shoshone (7.1%, a difference of 0.040%), Delaware (7.1%, a difference of 0.13%), Immigrants from Dominican Republic (7.1%, a difference of 0.28%), and Cree (7.1%, a difference of 0.35%).
| Demographics | Rating | Rank | Ambulatory Disability |
| Iroquois | 0.0 /100 | #306 | Tragic 7.1% |
| Spanish Americans | 0.0 /100 | #307 | Tragic 7.1% |
| Chippewa | 0.0 /100 | #308 | Tragic 7.1% |
| Immigrants | Azores | 0.0 /100 | #309 | Tragic 7.1% |
| Arapaho | 0.0 /100 | #310 | Tragic 7.1% |
| Cree | 0.0 /100 | #311 | Tragic 7.1% |
| Delaware | 0.0 /100 | #312 | Tragic 7.1% |
| Immigrants | Yemen | 0.0 /100 | #313 | Tragic 7.1% |
| Blackfeet | 0.0 /100 | #314 | Tragic 7.1% |
| Shoshone | 0.0 /100 | #315 | Tragic 7.1% |
| Immigrants | Dominican Republic | 0.0 /100 | #316 | Tragic 7.1% |
| Central American Indians | 0.0 /100 | #317 | Tragic 7.2% |
| Ottawa | 0.0 /100 | #318 | Tragic 7.2% |
| Dominicans | 0.0 /100 | #319 | Tragic 7.2% |
| Potawatomi | 0.0 /100 | #320 | Tragic 7.3% |