Spanish vs Immigrants from Ghana Ambulatory Disability
COMPARE
Spanish
Immigrants from Ghana
Ambulatory Disability
Ambulatory Disability Comparison
Spanish
Immigrants from Ghana
6.6%
AMBULATORY DISABILITY
0.2/ 100
METRIC RATING
268th/ 347
METRIC RANK
6.1%
AMBULATORY DISABILITY
41.2/ 100
METRIC RATING
184th/ 347
METRIC RANK
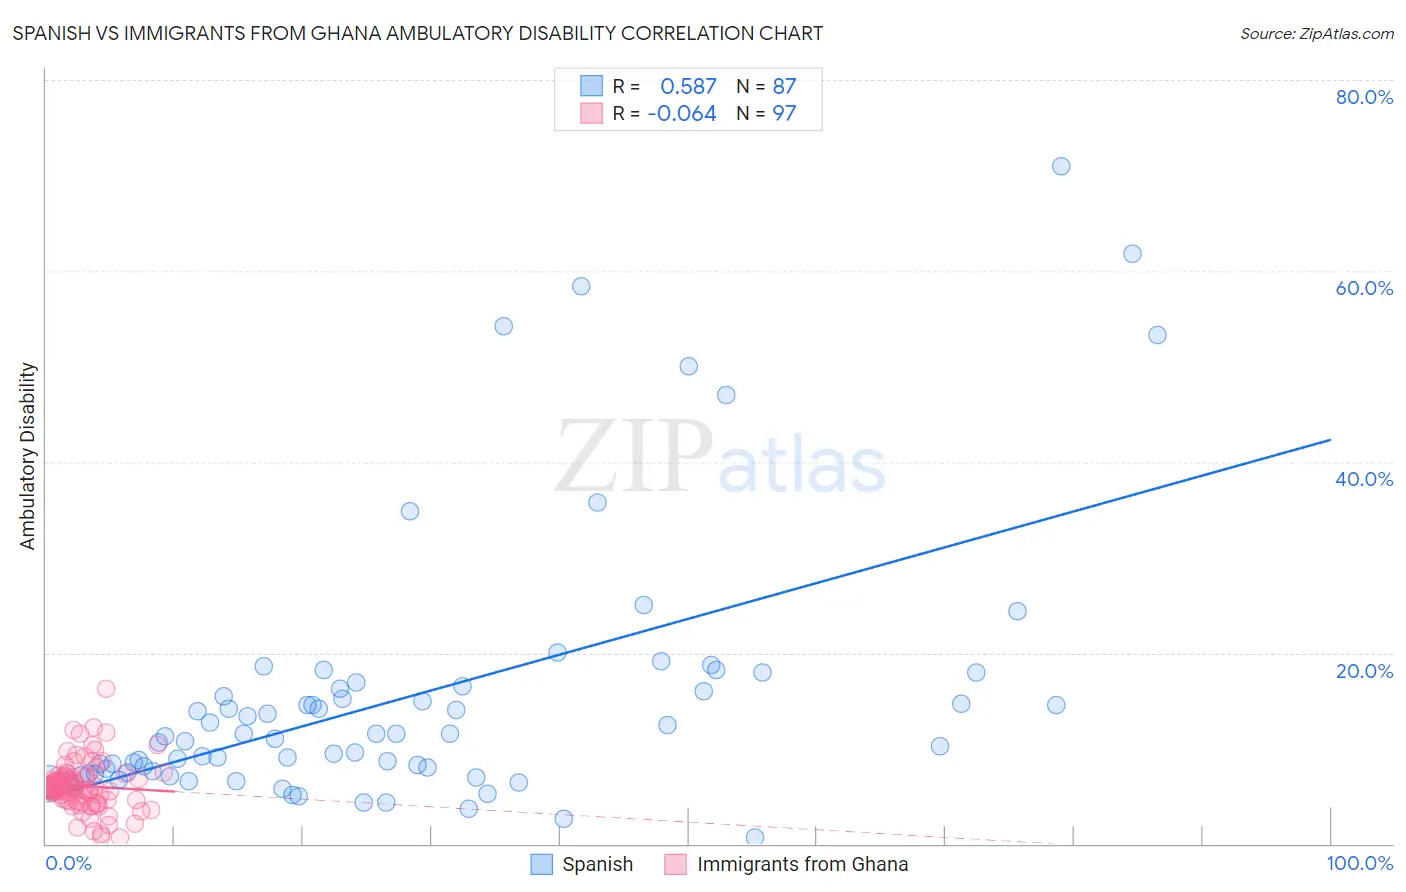
Spanish vs Immigrants from Ghana Ambulatory Disability Correlation Chart
The statistical analysis conducted on geographies consisting of 421,992,199 people shows a substantial positive correlation between the proportion of Spanish and percentage of population with ambulatory disability in the United States with a correlation coefficient (R) of 0.587 and weighted average of 6.6%. Similarly, the statistical analysis conducted on geographies consisting of 199,872,719 people shows a slight negative correlation between the proportion of Immigrants from Ghana and percentage of population with ambulatory disability in the United States with a correlation coefficient (R) of -0.064 and weighted average of 6.1%, a difference of 7.8%.
Ambulatory Disability Correlation Summary
| Measurement | Spanish | Immigrants from Ghana |
| Minimum | 0.68% | 0.61% |
| Maximum | 71.0% | 16.2% |
| Range | 70.3% | 15.6% |
| Mean | 15.1% | 6.0% |
| Median | 11.0% | 5.9% |
| Interquartile 25% (IQ1) | 7.3% | 4.6% |
| Interquartile 75% (IQ3) | 16.2% | 7.0% |
| Interquartile Range (IQR) | 8.9% | 2.4% |
| Standard Deviation (Sample) | 13.9% | 2.5% |
| Standard Deviation (Population) | 13.8% | 2.5% |
Similar Demographics by Ambulatory Disability
Demographics Similar to Spanish by Ambulatory Disability
In terms of ambulatory disability, the demographic groups most similar to Spanish are Trinidadian and Tobagonian (6.6%, a difference of 0.020%), Guyanese (6.6%, a difference of 0.14%), Bahamian (6.6%, a difference of 0.26%), French (6.6%, a difference of 0.31%), and Nepalese (6.6%, a difference of 0.33%).
| Demographics | Rating | Rank | Ambulatory Disability |
| Irish | 0.4 /100 | #261 | Tragic 6.6% |
| English | 0.4 /100 | #262 | Tragic 6.6% |
| Hmong | 0.3 /100 | #263 | Tragic 6.6% |
| Nepalese | 0.2 /100 | #264 | Tragic 6.6% |
| Bahamians | 0.2 /100 | #265 | Tragic 6.6% |
| Guyanese | 0.2 /100 | #266 | Tragic 6.6% |
| Trinidadians and Tobagonians | 0.2 /100 | #267 | Tragic 6.6% |
| Spanish | 0.2 /100 | #268 | Tragic 6.6% |
| French | 0.1 /100 | #269 | Tragic 6.6% |
| Slovaks | 0.1 /100 | #270 | Tragic 6.7% |
| Immigrants | Trinidad and Tobago | 0.1 /100 | #271 | Tragic 6.7% |
| French Canadians | 0.1 /100 | #272 | Tragic 6.7% |
| Whites/Caucasians | 0.1 /100 | #273 | Tragic 6.7% |
| Sioux | 0.1 /100 | #274 | Tragic 6.7% |
| Immigrants | Guyana | 0.1 /100 | #275 | Tragic 6.7% |
Demographics Similar to Immigrants from Ghana by Ambulatory Disability
In terms of ambulatory disability, the demographic groups most similar to Immigrants from Ghana are Immigrants from Thailand (6.1%, a difference of 0.050%), Serbian (6.1%, a difference of 0.090%), Swiss (6.1%, a difference of 0.10%), Austrian (6.1%, a difference of 0.15%), and Immigrants from Nicaragua (6.1%, a difference of 0.15%).
| Demographics | Rating | Rank | Ambulatory Disability |
| Immigrants | England | 45.4 /100 | #177 | Average 6.1% |
| Scandinavians | 44.5 /100 | #178 | Average 6.1% |
| Austrians | 44.1 /100 | #179 | Average 6.1% |
| Immigrants | Nicaragua | 43.9 /100 | #180 | Average 6.1% |
| Swiss | 43.1 /100 | #181 | Average 6.1% |
| Serbians | 42.8 /100 | #182 | Average 6.1% |
| Immigrants | Thailand | 42.2 /100 | #183 | Average 6.1% |
| Immigrants | Ghana | 41.2 /100 | #184 | Average 6.1% |
| Immigrants | Bosnia and Herzegovina | 37.2 /100 | #185 | Fair 6.2% |
| Europeans | 36.2 /100 | #186 | Fair 6.2% |
| Carpatho Rusyns | 35.3 /100 | #187 | Fair 6.2% |
| British | 34.3 /100 | #188 | Fair 6.2% |
| Ukrainians | 34.0 /100 | #189 | Fair 6.2% |
| Immigrants | Western Africa | 33.4 /100 | #190 | Fair 6.2% |
| Immigrants | Guatemala | 31.9 /100 | #191 | Fair 6.2% |