Spanish vs Immigrants from Ethiopia Hearing Disability
COMPARE
Spanish
Immigrants from Ethiopia
Hearing Disability
Hearing Disability Comparison
Spanish
Immigrants from Ethiopia
3.7%
HEARING DISABILITY
0.0/ 100
METRIC RATING
287th/ 347
METRIC RANK
2.7%
HEARING DISABILITY
99.0/ 100
METRIC RATING
55th/ 347
METRIC RANK
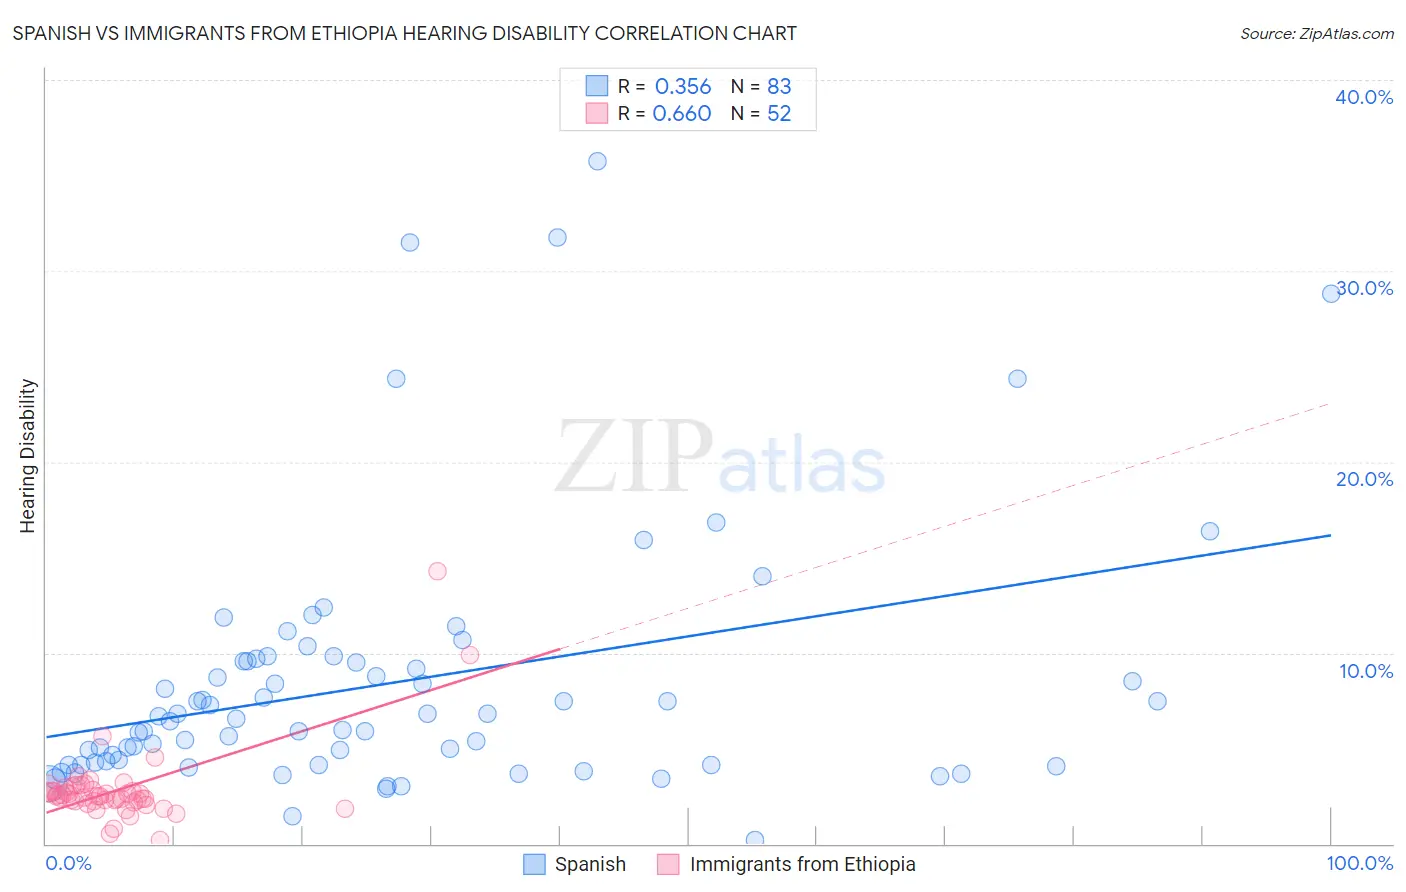
Spanish vs Immigrants from Ethiopia Hearing Disability Correlation Chart
The statistical analysis conducted on geographies consisting of 421,995,316 people shows a mild positive correlation between the proportion of Spanish and percentage of population with hearing disability in the United States with a correlation coefficient (R) of 0.356 and weighted average of 3.7%. Similarly, the statistical analysis conducted on geographies consisting of 211,510,601 people shows a significant positive correlation between the proportion of Immigrants from Ethiopia and percentage of population with hearing disability in the United States with a correlation coefficient (R) of 0.660 and weighted average of 2.7%, a difference of 36.5%.
Hearing Disability Correlation Summary
| Measurement | Spanish | Immigrants from Ethiopia |
| Minimum | 0.21% | 0.17% |
| Maximum | 35.7% | 14.3% |
| Range | 35.5% | 14.1% |
| Mean | 8.4% | 2.8% |
| Median | 6.5% | 2.5% |
| Interquartile 25% (IQ1) | 4.1% | 2.2% |
| Interquartile 75% (IQ3) | 9.6% | 2.9% |
| Interquartile Range (IQR) | 5.5% | 0.64% |
| Standard Deviation (Sample) | 6.8% | 2.1% |
| Standard Deviation (Population) | 6.8% | 2.1% |
Similar Demographics by Hearing Disability
Demographics Similar to Spanish by Hearing Disability
In terms of hearing disability, the demographic groups most similar to Spanish are Delaware (3.6%, a difference of 0.24%), Sioux (3.6%, a difference of 0.28%), Immigrants from Micronesia (3.6%, a difference of 0.38%), Irish (3.7%, a difference of 0.57%), and Chinese (3.7%, a difference of 0.78%).
| Demographics | Rating | Rank | Hearing Disability |
| French American Indians | 0.0 /100 | #280 | Tragic 3.6% |
| Scandinavians | 0.0 /100 | #281 | Tragic 3.6% |
| Swedes | 0.0 /100 | #282 | Tragic 3.6% |
| Blackfeet | 0.0 /100 | #283 | Tragic 3.6% |
| Immigrants | Micronesia | 0.0 /100 | #284 | Tragic 3.6% |
| Sioux | 0.0 /100 | #285 | Tragic 3.6% |
| Delaware | 0.0 /100 | #286 | Tragic 3.6% |
| Spanish | 0.0 /100 | #287 | Tragic 3.7% |
| Irish | 0.0 /100 | #288 | Tragic 3.7% |
| Chinese | 0.0 /100 | #289 | Tragic 3.7% |
| Whites/Caucasians | 0.0 /100 | #290 | Tragic 3.7% |
| Finns | 0.0 /100 | #291 | Tragic 3.7% |
| Native Hawaiians | 0.0 /100 | #292 | Tragic 3.7% |
| Norwegians | 0.0 /100 | #293 | Tragic 3.7% |
| Iroquois | 0.0 /100 | #294 | Tragic 3.7% |
Demographics Similar to Immigrants from Ethiopia by Hearing Disability
In terms of hearing disability, the demographic groups most similar to Immigrants from Ethiopia are Immigrants from Nicaragua (2.7%, a difference of 0.020%), Ethiopian (2.7%, a difference of 0.060%), South American (2.7%, a difference of 0.070%), Immigrants from Eastern Asia (2.7%, a difference of 0.10%), and Jamaican (2.7%, a difference of 0.16%).
| Demographics | Rating | Rank | Hearing Disability |
| Immigrants | Singapore | 99.3 /100 | #48 | Exceptional 2.6% |
| Immigrants | South America | 99.2 /100 | #49 | Exceptional 2.7% |
| Paraguayans | 99.2 /100 | #50 | Exceptional 2.7% |
| Immigrants | Hong Kong | 99.2 /100 | #51 | Exceptional 2.7% |
| Jamaicans | 99.0 /100 | #52 | Exceptional 2.7% |
| Immigrants | Eastern Asia | 99.0 /100 | #53 | Exceptional 2.7% |
| Ethiopians | 99.0 /100 | #54 | Exceptional 2.7% |
| Immigrants | Ethiopia | 99.0 /100 | #55 | Exceptional 2.7% |
| Immigrants | Nicaragua | 99.0 /100 | #56 | Exceptional 2.7% |
| South Americans | 99.0 /100 | #57 | Exceptional 2.7% |
| Immigrants | Peru | 98.6 /100 | #58 | Exceptional 2.7% |
| Immigrants | Eritrea | 98.5 /100 | #59 | Exceptional 2.7% |
| Immigrants | Egypt | 98.5 /100 | #60 | Exceptional 2.7% |
| Immigrants | Uzbekistan | 98.4 /100 | #61 | Exceptional 2.7% |
| Immigrants | Colombia | 98.4 /100 | #62 | Exceptional 2.7% |