Spanish vs Immigrants from Guatemala Disability
COMPARE
Spanish
Immigrants from Guatemala
Disability
Disability Comparison
Spanish
Immigrants from Guatemala
12.8%
DISABILITY
0.0/ 100
METRIC RATING
280th/ 347
METRIC RANK
11.6%
DISABILITY
71.1/ 100
METRIC RATING
154th/ 347
METRIC RANK
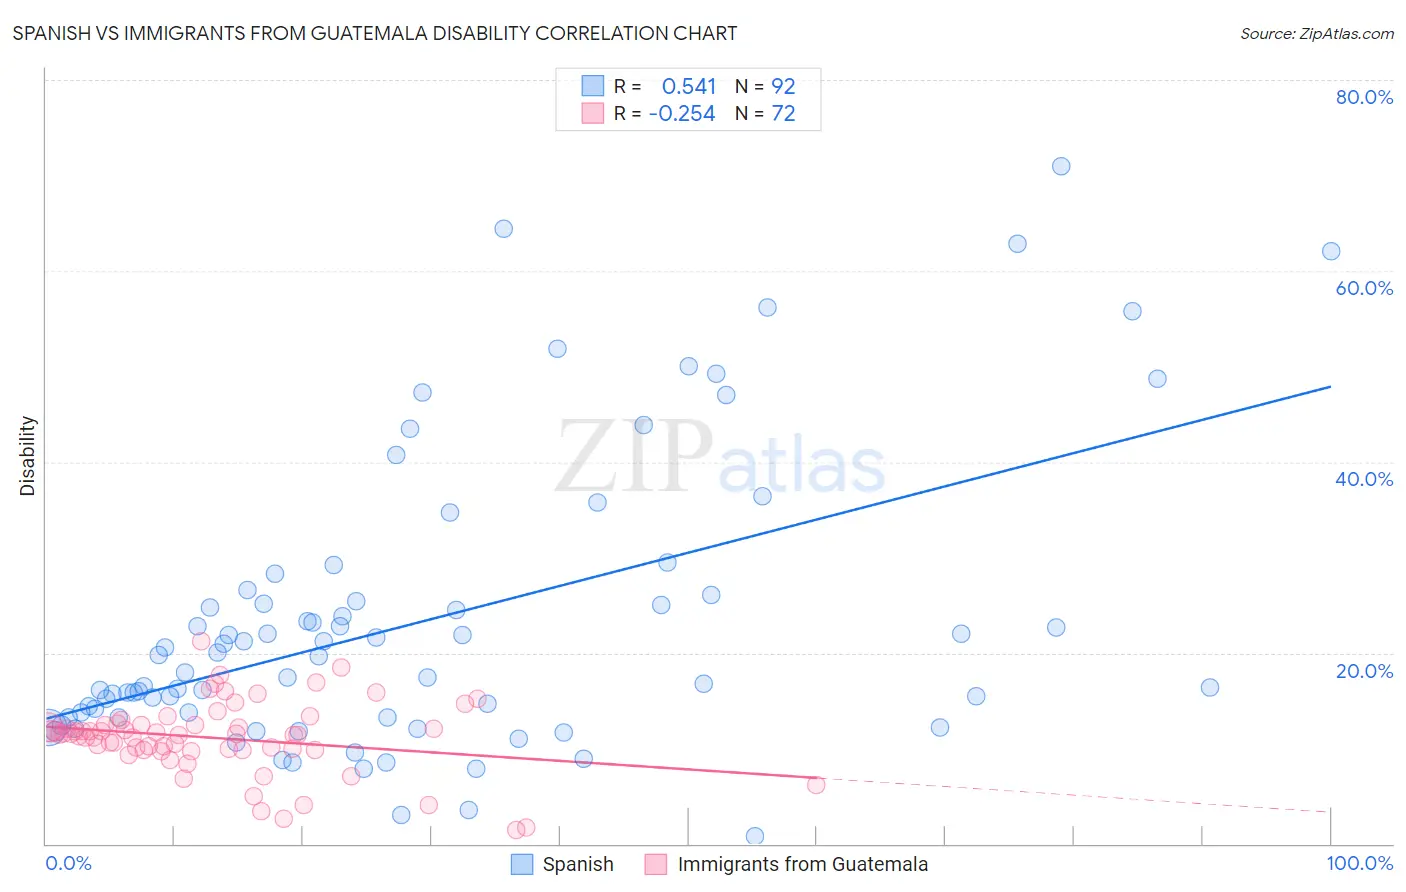
Spanish vs Immigrants from Guatemala Disability Correlation Chart
The statistical analysis conducted on geographies consisting of 422,113,080 people shows a substantial positive correlation between the proportion of Spanish and percentage of population with a disability in the United States with a correlation coefficient (R) of 0.541 and weighted average of 12.8%. Similarly, the statistical analysis conducted on geographies consisting of 377,234,286 people shows a weak negative correlation between the proportion of Immigrants from Guatemala and percentage of population with a disability in the United States with a correlation coefficient (R) of -0.254 and weighted average of 11.6%, a difference of 10.9%.
Disability Correlation Summary
| Measurement | Spanish | Immigrants from Guatemala |
| Minimum | 0.84% | 1.4% |
| Maximum | 71.0% | 21.3% |
| Range | 70.1% | 19.8% |
| Mean | 23.3% | 11.1% |
| Median | 18.8% | 11.5% |
| Interquartile 25% (IQ1) | 13.2% | 9.8% |
| Interquartile 75% (IQ3) | 25.7% | 12.5% |
| Interquartile Range (IQR) | 12.5% | 2.7% |
| Standard Deviation (Sample) | 15.1% | 3.8% |
| Standard Deviation (Population) | 15.0% | 3.7% |
Similar Demographics by Disability
Demographics Similar to Spanish by Disability
In terms of disability, the demographic groups most similar to Spanish are Fijian (12.8%, a difference of 0.050%), Immigrants from Portugal (12.9%, a difference of 0.14%), German (12.8%, a difference of 0.15%), Scottish (12.9%, a difference of 0.28%), and Irish (12.9%, a difference of 0.30%).
| Demographics | Rating | Rank | Disability |
| Finns | 0.0 /100 | #273 | Tragic 12.7% |
| Nepalese | 0.0 /100 | #274 | Tragic 12.8% |
| Sioux | 0.0 /100 | #275 | Tragic 12.8% |
| Hmong | 0.0 /100 | #276 | Tragic 12.8% |
| Dutch | 0.0 /100 | #277 | Tragic 12.8% |
| Germans | 0.0 /100 | #278 | Tragic 12.8% |
| Fijians | 0.0 /100 | #279 | Tragic 12.8% |
| Spanish | 0.0 /100 | #280 | Tragic 12.8% |
| Immigrants | Portugal | 0.0 /100 | #281 | Tragic 12.9% |
| Scottish | 0.0 /100 | #282 | Tragic 12.9% |
| Irish | 0.0 /100 | #283 | Tragic 12.9% |
| Welsh | 0.0 /100 | #284 | Tragic 12.9% |
| Crow | 0.0 /100 | #285 | Tragic 12.9% |
| English | 0.0 /100 | #286 | Tragic 13.0% |
| Africans | 0.0 /100 | #287 | Tragic 13.0% |
Demographics Similar to Immigrants from Guatemala by Disability
In terms of disability, the demographic groups most similar to Immigrants from Guatemala are Immigrants from Ghana (11.6%, a difference of 0.0%), Immigrants from Kenya (11.6%, a difference of 0.050%), Immigrants from Moldova (11.6%, a difference of 0.050%), Immigrants from Netherlands (11.6%, a difference of 0.070%), and Romanian (11.6%, a difference of 0.080%).
| Demographics | Rating | Rank | Disability |
| Immigrants | Ukraine | 77.6 /100 | #147 | Good 11.5% |
| Sudanese | 77.1 /100 | #148 | Good 11.5% |
| Immigrants | Norway | 73.2 /100 | #149 | Good 11.6% |
| Romanians | 72.7 /100 | #150 | Good 11.6% |
| Immigrants | Kenya | 72.1 /100 | #151 | Good 11.6% |
| Immigrants | Moldova | 72.0 /100 | #152 | Good 11.6% |
| Immigrants | Ghana | 71.2 /100 | #153 | Good 11.6% |
| Immigrants | Guatemala | 71.1 /100 | #154 | Good 11.6% |
| Immigrants | Netherlands | 69.8 /100 | #155 | Good 11.6% |
| Immigrants | Fiji | 69.5 /100 | #156 | Good 11.6% |
| Immigrants | Middle Africa | 69.5 /100 | #157 | Good 11.6% |
| Armenians | 65.9 /100 | #158 | Good 11.6% |
| Guatemalans | 65.1 /100 | #159 | Good 11.6% |
| Immigrants | Barbados | 64.2 /100 | #160 | Good 11.6% |
| Immigrants | Cuba | 62.8 /100 | #161 | Good 11.6% |