Spanish vs Immigrants from Nicaragua Disability
COMPARE
Spanish
Immigrants from Nicaragua
Disability
Disability Comparison
Spanish
Immigrants from Nicaragua
12.8%
DISABILITY
0.0/ 100
METRIC RATING
280th/ 347
METRIC RANK
11.3%
DISABILITY
96.8/ 100
METRIC RATING
101st/ 347
METRIC RANK
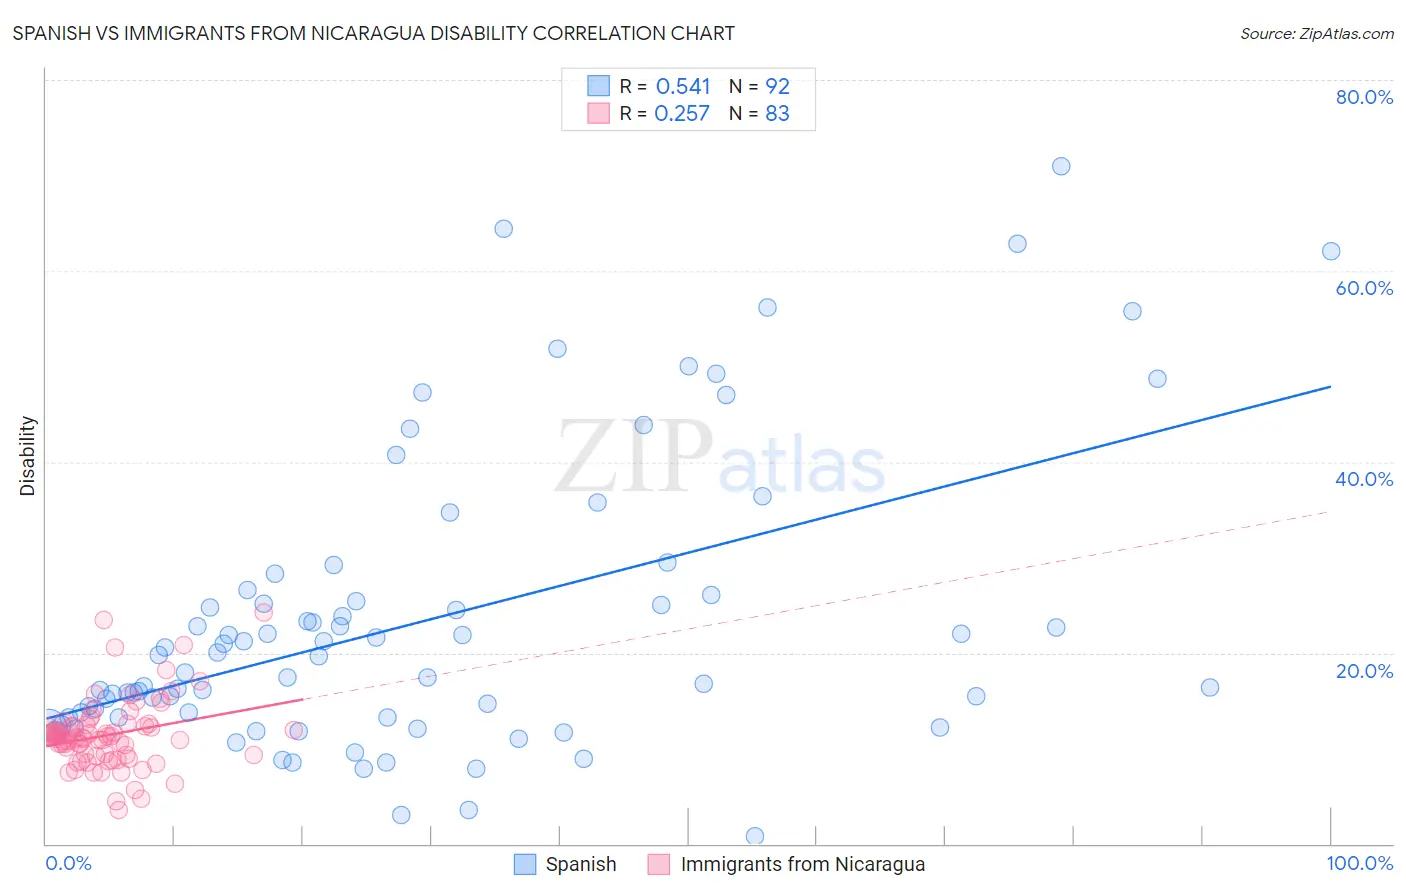
Spanish vs Immigrants from Nicaragua Disability Correlation Chart
The statistical analysis conducted on geographies consisting of 422,113,080 people shows a substantial positive correlation between the proportion of Spanish and percentage of population with a disability in the United States with a correlation coefficient (R) of 0.541 and weighted average of 12.8%. Similarly, the statistical analysis conducted on geographies consisting of 236,329,178 people shows a weak positive correlation between the proportion of Immigrants from Nicaragua and percentage of population with a disability in the United States with a correlation coefficient (R) of 0.257 and weighted average of 11.3%, a difference of 14.1%.
Disability Correlation Summary
| Measurement | Spanish | Immigrants from Nicaragua |
| Minimum | 0.84% | 3.5% |
| Maximum | 71.0% | 24.3% |
| Range | 70.1% | 20.8% |
| Mean | 23.3% | 11.4% |
| Median | 18.8% | 11.1% |
| Interquartile 25% (IQ1) | 13.2% | 9.3% |
| Interquartile 75% (IQ3) | 25.7% | 12.3% |
| Interquartile Range (IQR) | 12.5% | 3.0% |
| Standard Deviation (Sample) | 15.1% | 3.6% |
| Standard Deviation (Population) | 15.0% | 3.6% |
Similar Demographics by Disability
Demographics Similar to Spanish by Disability
In terms of disability, the demographic groups most similar to Spanish are Fijian (12.8%, a difference of 0.050%), Immigrants from Portugal (12.9%, a difference of 0.14%), German (12.8%, a difference of 0.15%), Scottish (12.9%, a difference of 0.28%), and Irish (12.9%, a difference of 0.30%).
| Demographics | Rating | Rank | Disability |
| Finns | 0.0 /100 | #273 | Tragic 12.7% |
| Nepalese | 0.0 /100 | #274 | Tragic 12.8% |
| Sioux | 0.0 /100 | #275 | Tragic 12.8% |
| Hmong | 0.0 /100 | #276 | Tragic 12.8% |
| Dutch | 0.0 /100 | #277 | Tragic 12.8% |
| Germans | 0.0 /100 | #278 | Tragic 12.8% |
| Fijians | 0.0 /100 | #279 | Tragic 12.8% |
| Spanish | 0.0 /100 | #280 | Tragic 12.8% |
| Immigrants | Portugal | 0.0 /100 | #281 | Tragic 12.9% |
| Scottish | 0.0 /100 | #282 | Tragic 12.9% |
| Irish | 0.0 /100 | #283 | Tragic 12.9% |
| Welsh | 0.0 /100 | #284 | Tragic 12.9% |
| Crow | 0.0 /100 | #285 | Tragic 12.9% |
| English | 0.0 /100 | #286 | Tragic 13.0% |
| Africans | 0.0 /100 | #287 | Tragic 13.0% |
Demographics Similar to Immigrants from Nicaragua by Disability
In terms of disability, the demographic groups most similar to Immigrants from Nicaragua are Immigrants from Greece (11.3%, a difference of 0.040%), Immigrants from Eastern Africa (11.3%, a difference of 0.060%), Immigrants from Uruguay (11.3%, a difference of 0.14%), Immigrants (11.3%, a difference of 0.14%), and Immigrants from Kazakhstan (11.3%, a difference of 0.15%).
| Demographics | Rating | Rank | Disability |
| Immigrants | Morocco | 97.8 /100 | #94 | Exceptional 11.2% |
| Eastern Europeans | 97.8 /100 | #95 | Exceptional 11.2% |
| Immigrants | Zimbabwe | 97.7 /100 | #96 | Exceptional 11.2% |
| Bhutanese | 97.4 /100 | #97 | Exceptional 11.2% |
| Uruguayans | 97.4 /100 | #98 | Exceptional 11.2% |
| Immigrants | Czechoslovakia | 97.4 /100 | #99 | Exceptional 11.2% |
| Immigrants | Greece | 96.9 /100 | #100 | Exceptional 11.3% |
| Immigrants | Nicaragua | 96.8 /100 | #101 | Exceptional 11.3% |
| Immigrants | Eastern Africa | 96.7 /100 | #102 | Exceptional 11.3% |
| Immigrants | Uruguay | 96.4 /100 | #103 | Exceptional 11.3% |
| Immigrants | Immigrants | 96.4 /100 | #104 | Exceptional 11.3% |
| Immigrants | Kazakhstan | 96.4 /100 | #105 | Exceptional 11.3% |
| Immigrants | Eastern Europe | 96.3 /100 | #106 | Exceptional 11.3% |
| Nicaraguans | 96.2 /100 | #107 | Exceptional 11.3% |
| Immigrants | Nigeria | 96.0 /100 | #108 | Exceptional 11.3% |