Spanish vs Arab Disability Age Under 5
COMPARE
Spanish
Arab
Disability Age Under 5
Disability Age Under 5 Comparison
Spanish
Arabs
1.4%
DISABILITY AGE UNDER 5
0.2/ 100
METRIC RATING
263rd/ 347
METRIC RANK
1.2%
DISABILITY AGE UNDER 5
66.4/ 100
METRIC RATING
158th/ 347
METRIC RANK
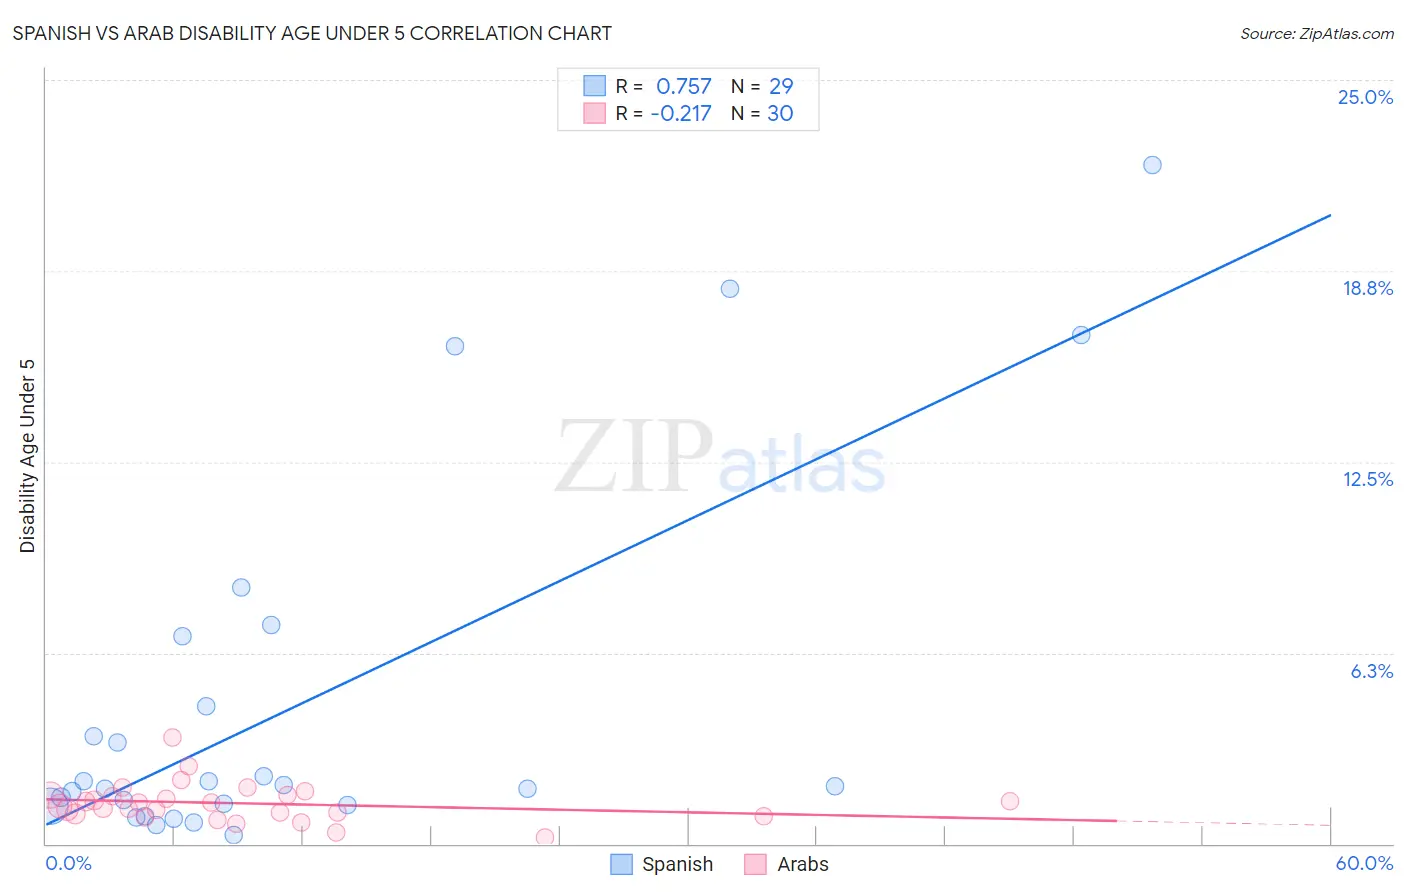
Spanish vs Arab Disability Age Under 5 Correlation Chart
The statistical analysis conducted on geographies consisting of 226,460,629 people shows a strong positive correlation between the proportion of Spanish and percentage of population with a disability under the age of 5 in the United States with a correlation coefficient (R) of 0.757 and weighted average of 1.4%. Similarly, the statistical analysis conducted on geographies consisting of 244,671,957 people shows a weak negative correlation between the proportion of Arabs and percentage of population with a disability under the age of 5 in the United States with a correlation coefficient (R) of -0.217 and weighted average of 1.2%, a difference of 16.3%.
Disability Age Under 5 Correlation Summary
| Measurement | Spanish | Arab |
| Minimum | 0.27% | 0.20% |
| Maximum | 22.2% | 3.5% |
| Range | 21.9% | 3.3% |
| Mean | 4.6% | 1.3% |
| Median | 1.9% | 1.3% |
| Interquartile 25% (IQ1) | 1.2% | 0.99% |
| Interquartile 75% (IQ3) | 5.7% | 1.6% |
| Interquartile Range (IQR) | 4.4% | 0.59% |
| Standard Deviation (Sample) | 6.0% | 0.64% |
| Standard Deviation (Population) | 5.9% | 0.63% |
Similar Demographics by Disability Age Under 5
Demographics Similar to Spanish by Disability Age Under 5
In terms of disability age under 5, the demographic groups most similar to Spanish are Immigrants from Dominica (1.4%, a difference of 0.060%), Yugoslavian (1.4%, a difference of 0.15%), Carpatho Rusyn (1.4%, a difference of 0.19%), Immigrants from Netherlands (1.4%, a difference of 0.22%), and Immigrants from Germany (1.4%, a difference of 0.22%).
| Demographics | Rating | Rank | Disability Age Under 5 |
| Immigrants | Western Europe | 0.5 /100 | #256 | Tragic 1.4% |
| Slovenes | 0.3 /100 | #257 | Tragic 1.4% |
| Costa Ricans | 0.3 /100 | #258 | Tragic 1.4% |
| Immigrants | Southern Europe | 0.3 /100 | #259 | Tragic 1.4% |
| Slavs | 0.3 /100 | #260 | Tragic 1.4% |
| Immigrants | Netherlands | 0.2 /100 | #261 | Tragic 1.4% |
| Immigrants | Dominica | 0.2 /100 | #262 | Tragic 1.4% |
| Spanish | 0.2 /100 | #263 | Tragic 1.4% |
| Yugoslavians | 0.1 /100 | #264 | Tragic 1.4% |
| Carpatho Rusyns | 0.1 /100 | #265 | Tragic 1.4% |
| Immigrants | Germany | 0.1 /100 | #266 | Tragic 1.4% |
| Cree | 0.1 /100 | #267 | Tragic 1.4% |
| Belgians | 0.1 /100 | #268 | Tragic 1.4% |
| Austrians | 0.1 /100 | #269 | Tragic 1.4% |
| Immigrants | North America | 0.1 /100 | #270 | Tragic 1.4% |
Demographics Similar to Arabs by Disability Age Under 5
In terms of disability age under 5, the demographic groups most similar to Arabs are Immigrants from South America (1.2%, a difference of 0.060%), Colombian (1.2%, a difference of 0.060%), Immigrants from Latin America (1.2%, a difference of 0.060%), Immigrants from Africa (1.2%, a difference of 0.13%), and Hawaiian (1.2%, a difference of 0.22%).
| Demographics | Rating | Rank | Disability Age Under 5 |
| Yaqui | 74.8 /100 | #151 | Good 1.2% |
| Hondurans | 72.5 /100 | #152 | Good 1.2% |
| Immigrants | Thailand | 69.4 /100 | #153 | Good 1.2% |
| Uruguayans | 68.8 /100 | #154 | Good 1.2% |
| Immigrants | Ghana | 68.7 /100 | #155 | Good 1.2% |
| Hawaiians | 68.5 /100 | #156 | Good 1.2% |
| Immigrants | South America | 67.0 /100 | #157 | Good 1.2% |
| Arabs | 66.4 /100 | #158 | Good 1.2% |
| Colombians | 65.8 /100 | #159 | Good 1.2% |
| Immigrants | Latin America | 65.8 /100 | #160 | Good 1.2% |
| Immigrants | Africa | 65.1 /100 | #161 | Good 1.2% |
| Guatemalans | 63.6 /100 | #162 | Good 1.2% |
| Immigrants | Guatemala | 63.2 /100 | #163 | Good 1.2% |
| Laotians | 62.8 /100 | #164 | Good 1.2% |
| Immigrants | Kuwait | 62.6 /100 | #165 | Good 1.2% |