Spanish American vs Immigrants from England Vision Disability
COMPARE
Spanish American
Immigrants from England
Vision Disability
Vision Disability Comparison
Spanish Americans
Immigrants from England
2.9%
VISION DISABILITY
0.0/ 100
METRIC RATING
326th/ 347
METRIC RANK
2.1%
VISION DISABILITY
62.8/ 100
METRIC RATING
166th/ 347
METRIC RANK
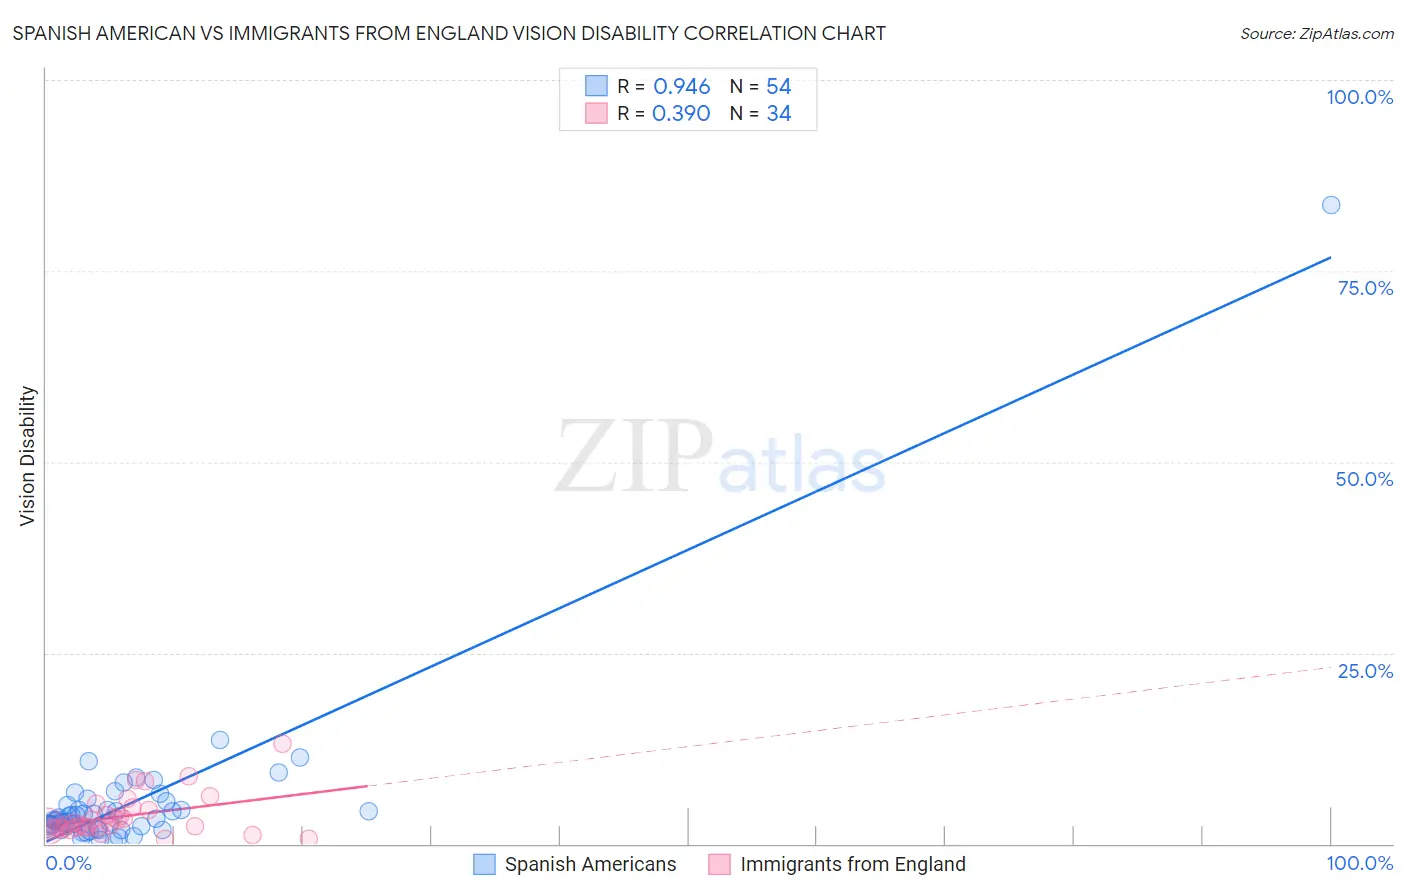
Spanish American vs Immigrants from England Vision Disability Correlation Chart
The statistical analysis conducted on geographies consisting of 103,153,251 people shows a near-perfect positive correlation between the proportion of Spanish Americans and percentage of population with vision disability in the United States with a correlation coefficient (R) of 0.946 and weighted average of 2.9%. Similarly, the statistical analysis conducted on geographies consisting of 391,606,709 people shows a mild positive correlation between the proportion of Immigrants from England and percentage of population with vision disability in the United States with a correlation coefficient (R) of 0.390 and weighted average of 2.1%, a difference of 37.1%.
Vision Disability Correlation Summary
| Measurement | Spanish American | Immigrants from England |
| Minimum | 0.38% | 0.66% |
| Maximum | 83.6% | 13.2% |
| Range | 83.3% | 12.5% |
| Mean | 5.5% | 3.6% |
| Median | 3.3% | 2.5% |
| Interquartile 25% (IQ1) | 2.3% | 2.1% |
| Interquartile 75% (IQ3) | 5.0% | 4.4% |
| Interquartile Range (IQR) | 2.7% | 2.3% |
| Standard Deviation (Sample) | 11.2% | 2.7% |
| Standard Deviation (Population) | 11.1% | 2.6% |
Similar Demographics by Vision Disability
Demographics Similar to Spanish Americans by Vision Disability
In terms of vision disability, the demographic groups most similar to Spanish Americans are Native/Alaskan (3.0%, a difference of 0.80%), Cherokee (2.9%, a difference of 1.2%), Hopi (2.9%, a difference of 1.2%), Yuman (3.0%, a difference of 1.3%), and Apache (3.0%, a difference of 1.5%).
| Demographics | Rating | Rank | Vision Disability |
| Tohono O'odham | 0.0 /100 | #319 | Tragic 2.8% |
| Blacks/African Americans | 0.0 /100 | #320 | Tragic 2.8% |
| Comanche | 0.0 /100 | #321 | Tragic 2.8% |
| Paiute | 0.0 /100 | #322 | Tragic 2.9% |
| Tlingit-Haida | 0.0 /100 | #323 | Tragic 2.9% |
| Hopi | 0.0 /100 | #324 | Tragic 2.9% |
| Cherokee | 0.0 /100 | #325 | Tragic 2.9% |
| Spanish Americans | 0.0 /100 | #326 | Tragic 2.9% |
| Natives/Alaskans | 0.0 /100 | #327 | Tragic 3.0% |
| Yuman | 0.0 /100 | #328 | Tragic 3.0% |
| Apache | 0.0 /100 | #329 | Tragic 3.0% |
| Colville | 0.0 /100 | #330 | Tragic 3.0% |
| Central American Indians | 0.0 /100 | #331 | Tragic 3.0% |
| Seminole | 0.0 /100 | #332 | Tragic 3.1% |
| Cajuns | 0.0 /100 | #333 | Tragic 3.1% |
Demographics Similar to Immigrants from England by Vision Disability
In terms of vision disability, the demographic groups most similar to Immigrants from England are Immigrants from Africa (2.1%, a difference of 0.010%), Brazilian (2.1%, a difference of 0.040%), Immigrants from Iraq (2.1%, a difference of 0.14%), Immigrants from Bangladesh (2.1%, a difference of 0.19%), and Icelander (2.1%, a difference of 0.23%).
| Demographics | Rating | Rank | Vision Disability |
| South Africans | 69.8 /100 | #159 | Good 2.1% |
| Austrians | 69.0 /100 | #160 | Good 2.1% |
| Iraqis | 67.7 /100 | #161 | Good 2.1% |
| Hungarians | 67.4 /100 | #162 | Good 2.1% |
| Icelanders | 66.1 /100 | #163 | Good 2.1% |
| Immigrants | Bangladesh | 65.5 /100 | #164 | Good 2.1% |
| Immigrants | Iraq | 64.8 /100 | #165 | Good 2.1% |
| Immigrants | England | 62.8 /100 | #166 | Good 2.1% |
| Immigrants | Africa | 62.6 /100 | #167 | Good 2.1% |
| Brazilians | 62.2 /100 | #168 | Good 2.1% |
| South American Indians | 57.4 /100 | #169 | Average 2.2% |
| Swiss | 55.7 /100 | #170 | Average 2.2% |
| Lebanese | 54.3 /100 | #171 | Average 2.2% |
| Northern Europeans | 50.1 /100 | #172 | Average 2.2% |
| Scandinavians | 50.0 /100 | #173 | Average 2.2% |