Bahamian vs Immigrants from the Azores Disability
COMPARE
Bahamian
Immigrants from the Azores
Disability
Disability Comparison
Bahamians
Immigrants from the Azores
12.2%
DISABILITY
2.3/ 100
METRIC RATING
233rd/ 347
METRIC RANK
14.2%
DISABILITY
0.0/ 100
METRIC RATING
328th/ 347
METRIC RANK
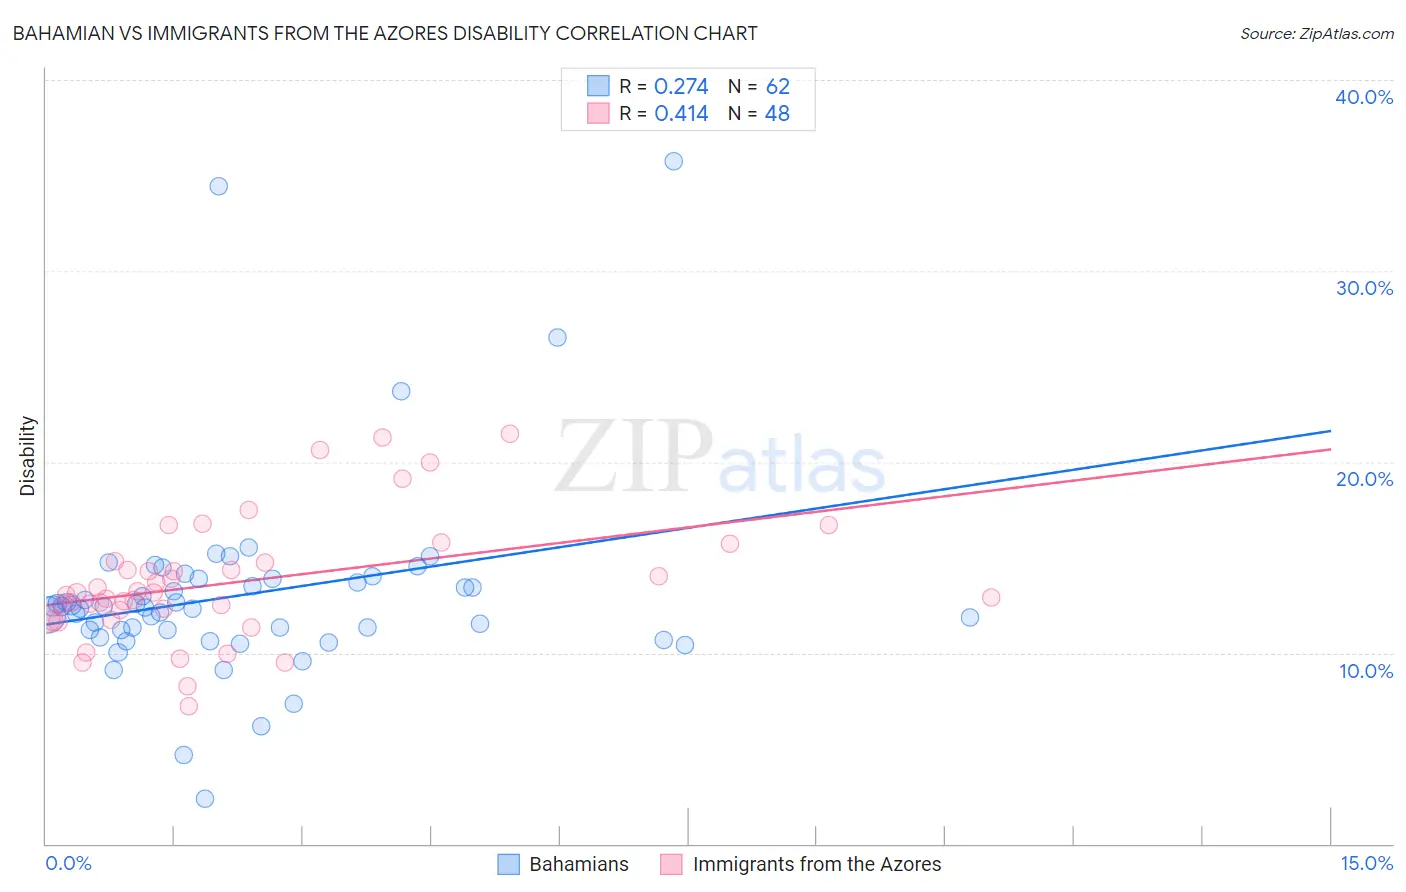
Bahamian vs Immigrants from the Azores Disability Correlation Chart
The statistical analysis conducted on geographies consisting of 112,688,060 people shows a weak positive correlation between the proportion of Bahamians and percentage of population with a disability in the United States with a correlation coefficient (R) of 0.274 and weighted average of 12.2%. Similarly, the statistical analysis conducted on geographies consisting of 46,257,178 people shows a moderate positive correlation between the proportion of Immigrants from the Azores and percentage of population with a disability in the United States with a correlation coefficient (R) of 0.414 and weighted average of 14.2%, a difference of 16.2%.
Disability Correlation Summary
| Measurement | Bahamian | Immigrants from the Azores |
| Minimum | 2.3% | 7.2% |
| Maximum | 35.8% | 21.5% |
| Range | 33.4% | 14.3% |
| Mean | 13.0% | 13.7% |
| Median | 12.4% | 13.1% |
| Interquartile 25% (IQ1) | 11.2% | 12.0% |
| Interquartile 75% (IQ3) | 13.9% | 14.8% |
| Interquartile Range (IQR) | 2.7% | 2.7% |
| Standard Deviation (Sample) | 5.3% | 3.2% |
| Standard Deviation (Population) | 5.2% | 3.1% |
Similar Demographics by Disability
Demographics Similar to Bahamians by Disability
In terms of disability, the demographic groups most similar to Bahamians are Japanese (12.2%, a difference of 0.030%), Yup'ik (12.2%, a difference of 0.070%), Italian (12.2%, a difference of 0.090%), Malaysian (12.2%, a difference of 0.10%), and Samoan (12.2%, a difference of 0.13%).
| Demographics | Rating | Rank | Disability |
| Jamaicans | 3.3 /100 | #226 | Tragic 12.1% |
| Alsatians | 3.3 /100 | #227 | Tragic 12.1% |
| West Indians | 2.9 /100 | #228 | Tragic 12.2% |
| Inupiat | 2.8 /100 | #229 | Tragic 12.2% |
| Samoans | 2.6 /100 | #230 | Tragic 12.2% |
| Malaysians | 2.5 /100 | #231 | Tragic 12.2% |
| Italians | 2.5 /100 | #232 | Tragic 12.2% |
| Bahamians | 2.3 /100 | #233 | Tragic 12.2% |
| Japanese | 2.3 /100 | #234 | Tragic 12.2% |
| Yup'ik | 2.2 /100 | #235 | Tragic 12.2% |
| Chinese | 2.0 /100 | #236 | Tragic 12.2% |
| Immigrants | Congo | 1.9 /100 | #237 | Tragic 12.2% |
| Norwegians | 1.9 /100 | #238 | Tragic 12.2% |
| Swedes | 1.8 /100 | #239 | Tragic 12.2% |
| Hungarians | 1.7 /100 | #240 | Tragic 12.2% |
Demographics Similar to Immigrants from the Azores by Disability
In terms of disability, the demographic groups most similar to Immigrants from the Azores are Ottawa (14.2%, a difference of 0.0%), Osage (14.2%, a difference of 0.020%), Native/Alaskan (14.2%, a difference of 0.060%), Chippewa (14.1%, a difference of 0.10%), and Potawatomi (14.2%, a difference of 0.12%).
| Demographics | Rating | Rank | Disability |
| Paiute | 0.0 /100 | #321 | Tragic 13.9% |
| Americans | 0.0 /100 | #322 | Tragic 13.9% |
| Comanche | 0.0 /100 | #323 | Tragic 14.1% |
| Chippewa | 0.0 /100 | #324 | Tragic 14.1% |
| Natives/Alaskans | 0.0 /100 | #325 | Tragic 14.2% |
| Osage | 0.0 /100 | #326 | Tragic 14.2% |
| Ottawa | 0.0 /100 | #327 | Tragic 14.2% |
| Immigrants | Azores | 0.0 /100 | #328 | Tragic 14.2% |
| Potawatomi | 0.0 /100 | #329 | Tragic 14.2% |
| Navajo | 0.0 /100 | #330 | Tragic 14.3% |
| Alaskan Athabascans | 0.0 /100 | #331 | Tragic 14.4% |
| Pueblo | 0.0 /100 | #332 | Tragic 14.4% |
| Cajuns | 0.0 /100 | #333 | Tragic 14.6% |
| Yuman | 0.0 /100 | #334 | Tragic 14.6% |
| Tohono O'odham | 0.0 /100 | #335 | Tragic 14.8% |