Spanish American vs Immigrants from the Azores In Labor Force | Age > 16
COMPARE
Spanish American
Immigrants from the Azores
In Labor Force | Age > 16
In Labor Force | Age > 16 Comparison
Spanish Americans
Immigrants from the Azores
63.6%
IN LABOR FORCE | AGE > 16
0.0/ 100
METRIC RATING
301st/ 347
METRIC RANK
63.6%
IN LABOR FORCE | AGE > 16
0.0/ 100
METRIC RATING
300th/ 347
METRIC RANK
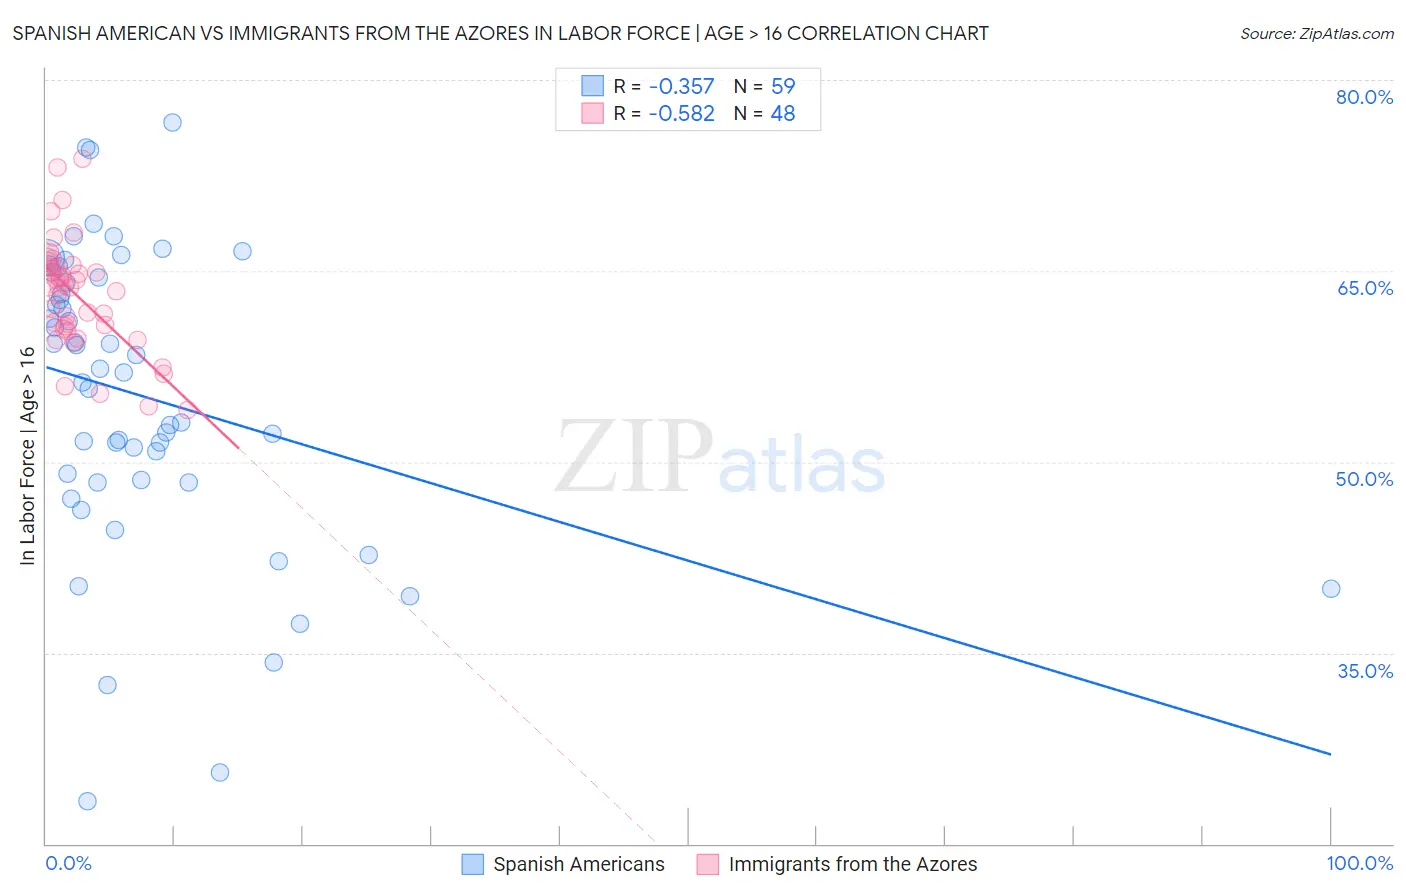
Spanish American vs Immigrants from the Azores In Labor Force | Age > 16 Correlation Chart
The statistical analysis conducted on geographies consisting of 103,168,383 people shows a mild negative correlation between the proportion of Spanish Americans and labor force participation rate among population ages 16 and over in the United States with a correlation coefficient (R) of -0.357 and weighted average of 63.6%. Similarly, the statistical analysis conducted on geographies consisting of 46,256,974 people shows a substantial negative correlation between the proportion of Immigrants from the Azores and labor force participation rate among population ages 16 and over in the United States with a correlation coefficient (R) of -0.582 and weighted average of 63.6%, a difference of 0.030%.
In Labor Force | Age > 16 Correlation Summary
| Measurement | Spanish American | Immigrants from the Azores |
| Minimum | 23.3% | 54.1% |
| Maximum | 76.7% | 73.8% |
| Range | 53.4% | 19.7% |
| Mean | 55.1% | 63.1% |
| Median | 57.0% | 63.7% |
| Interquartile 25% (IQ1) | 48.4% | 60.6% |
| Interquartile 75% (IQ3) | 64.5% | 65.3% |
| Interquartile Range (IQR) | 16.1% | 4.7% |
| Standard Deviation (Sample) | 11.7% | 4.3% |
| Standard Deviation (Population) | 11.6% | 4.2% |
Demographics Similar to Spanish Americans and Immigrants from the Azores by In Labor Force | Age > 16
In terms of in labor force | age > 16, the demographic groups most similar to Spanish Americans are Delaware (63.6%, a difference of 0.010%), White/Caucasian (63.6%, a difference of 0.030%), Cree (63.5%, a difference of 0.050%), Comanche (63.6%, a difference of 0.090%), and Immigrants from Grenada (63.6%, a difference of 0.10%). Similarly, the demographic groups most similar to Immigrants from the Azores are White/Caucasian (63.6%, a difference of 0.010%), Delaware (63.6%, a difference of 0.040%), Comanche (63.6%, a difference of 0.060%), Immigrants from Grenada (63.6%, a difference of 0.070%), and Cree (63.5%, a difference of 0.080%).
| Demographics | Rating | Rank | In Labor Force | Age > 16 |
| Hungarians | 0.1 /100 | #290 | Tragic 63.8% |
| Nepalese | 0.1 /100 | #291 | Tragic 63.8% |
| Spanish American Indians | 0.1 /100 | #292 | Tragic 63.8% |
| English | 0.1 /100 | #293 | Tragic 63.7% |
| Puget Sound Salish | 0.0 /100 | #294 | Tragic 63.7% |
| Immigrants | Canada | 0.0 /100 | #295 | Tragic 63.7% |
| Immigrants | North America | 0.0 /100 | #296 | Tragic 63.7% |
| Immigrants | Grenada | 0.0 /100 | #297 | Tragic 63.6% |
| Comanche | 0.0 /100 | #298 | Tragic 63.6% |
| Whites/Caucasians | 0.0 /100 | #299 | Tragic 63.6% |
| Immigrants | Azores | 0.0 /100 | #300 | Tragic 63.6% |
| Spanish Americans | 0.0 /100 | #301 | Tragic 63.6% |
| Delaware | 0.0 /100 | #302 | Tragic 63.6% |
| Cree | 0.0 /100 | #303 | Tragic 63.5% |
| Immigrants | Nonimmigrants | 0.0 /100 | #304 | Tragic 63.5% |
| Osage | 0.0 /100 | #305 | Tragic 63.5% |
| Blacks/African Americans | 0.0 /100 | #306 | Tragic 63.4% |
| Central American Indians | 0.0 /100 | #307 | Tragic 63.4% |
| Pennsylvania Germans | 0.0 /100 | #308 | Tragic 63.4% |
| Scotch-Irish | 0.0 /100 | #309 | Tragic 63.3% |
| Shoshone | 0.0 /100 | #310 | Tragic 63.2% |