Spanish American Indian vs Bhutanese Ambulatory Disability
COMPARE
Spanish American Indian
Bhutanese
Ambulatory Disability
Ambulatory Disability Comparison
Spanish American Indians
Bhutanese
6.5%
AMBULATORY DISABILITY
0.5/ 100
METRIC RATING
258th/ 347
METRIC RANK
5.8%
AMBULATORY DISABILITY
98.8/ 100
METRIC RATING
89th/ 347
METRIC RANK
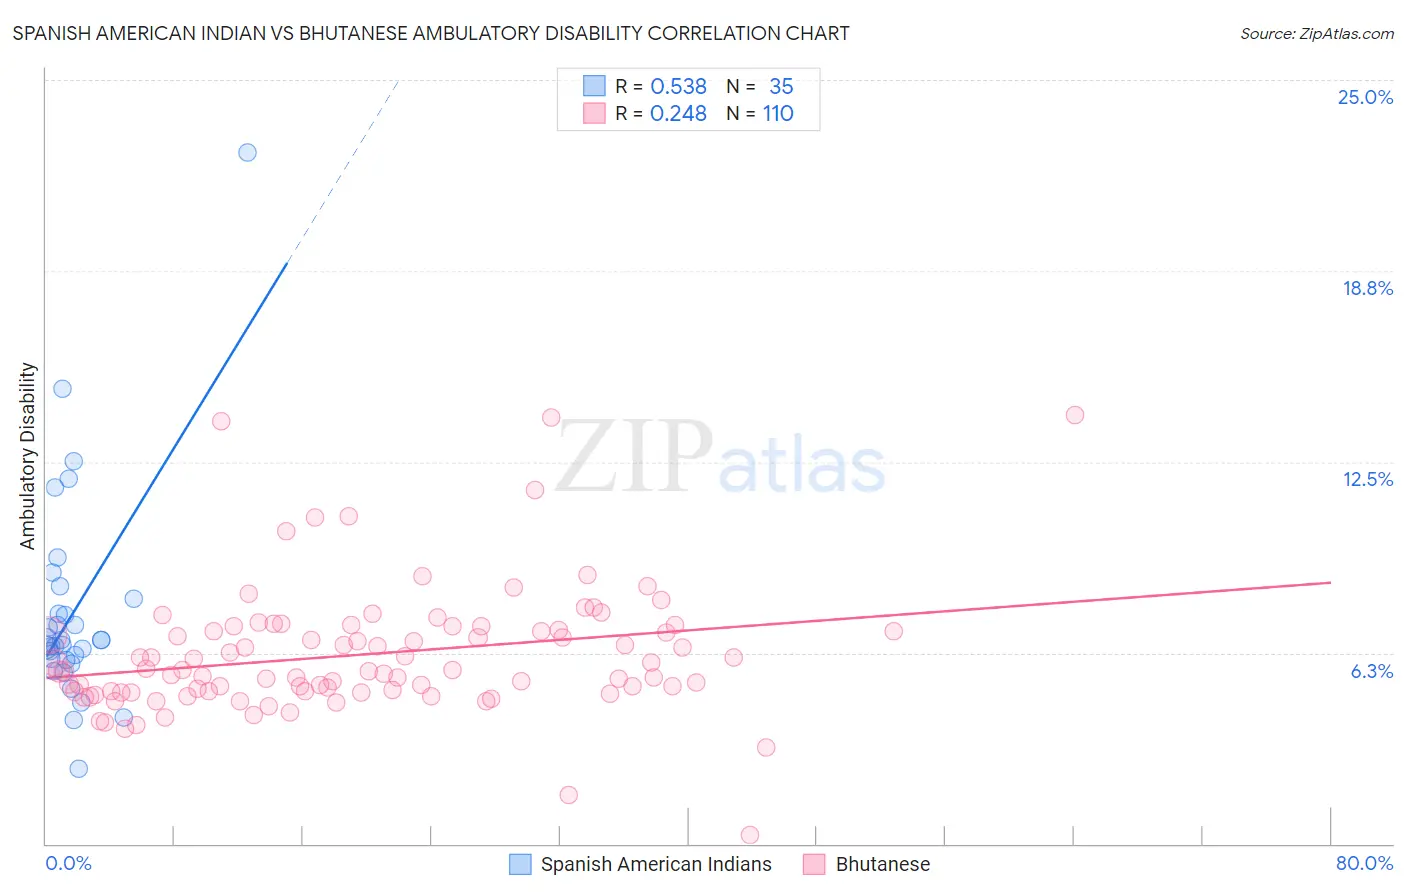
Spanish American Indian vs Bhutanese Ambulatory Disability Correlation Chart
The statistical analysis conducted on geographies consisting of 73,149,525 people shows a substantial positive correlation between the proportion of Spanish American Indians and percentage of population with ambulatory disability in the United States with a correlation coefficient (R) of 0.538 and weighted average of 6.5%. Similarly, the statistical analysis conducted on geographies consisting of 455,305,094 people shows a weak positive correlation between the proportion of Bhutanese and percentage of population with ambulatory disability in the United States with a correlation coefficient (R) of 0.248 and weighted average of 5.8%, a difference of 13.6%.
Ambulatory Disability Correlation Summary
| Measurement | Spanish American Indian | Bhutanese |
| Minimum | 2.4% | 0.28% |
| Maximum | 22.6% | 14.0% |
| Range | 20.2% | 13.8% |
| Mean | 7.6% | 6.2% |
| Median | 6.7% | 5.7% |
| Interquartile 25% (IQ1) | 6.0% | 5.0% |
| Interquartile 75% (IQ3) | 8.0% | 7.0% |
| Interquartile Range (IQR) | 2.0% | 2.0% |
| Standard Deviation (Sample) | 3.6% | 2.1% |
| Standard Deviation (Population) | 3.5% | 2.1% |
Similar Demographics by Ambulatory Disability
Demographics Similar to Spanish American Indians by Ambulatory Disability
In terms of ambulatory disability, the demographic groups most similar to Spanish American Indians are Bermudan (6.5%, a difference of 0.080%), Immigrants from Uzbekistan (6.5%, a difference of 0.16%), Aleut (6.6%, a difference of 0.18%), Immigrants from Belize (6.6%, a difference of 0.19%), and Welsh (6.5%, a difference of 0.23%).
| Demographics | Rating | Rank | Ambulatory Disability |
| Hawaiians | 0.9 /100 | #251 | Tragic 6.5% |
| Immigrants | Bahamas | 0.8 /100 | #252 | Tragic 6.5% |
| Scottish | 0.7 /100 | #253 | Tragic 6.5% |
| Belizeans | 0.7 /100 | #254 | Tragic 6.5% |
| Welsh | 0.6 /100 | #255 | Tragic 6.5% |
| Immigrants | Uzbekistan | 0.6 /100 | #256 | Tragic 6.5% |
| Bermudans | 0.5 /100 | #257 | Tragic 6.5% |
| Spanish American Indians | 0.5 /100 | #258 | Tragic 6.5% |
| Aleuts | 0.4 /100 | #259 | Tragic 6.6% |
| Immigrants | Belize | 0.4 /100 | #260 | Tragic 6.6% |
| Irish | 0.4 /100 | #261 | Tragic 6.6% |
| English | 0.4 /100 | #262 | Tragic 6.6% |
| Hmong | 0.3 /100 | #263 | Tragic 6.6% |
| Nepalese | 0.2 /100 | #264 | Tragic 6.6% |
| Bahamians | 0.2 /100 | #265 | Tragic 6.6% |
Demographics Similar to Bhutanese by Ambulatory Disability
In terms of ambulatory disability, the demographic groups most similar to Bhutanese are Australian (5.8%, a difference of 0.0%), Immigrants from Sudan (5.8%, a difference of 0.0%), Soviet Union (5.8%, a difference of 0.12%), Immigrants from Chile (5.8%, a difference of 0.16%), and Immigrants from Sierra Leone (5.8%, a difference of 0.17%).
| Demographics | Rating | Rank | Ambulatory Disability |
| Palestinians | 99.2 /100 | #82 | Exceptional 5.7% |
| Eastern Europeans | 99.2 /100 | #83 | Exceptional 5.7% |
| Ugandans | 99.2 /100 | #84 | Exceptional 5.7% |
| South Americans | 99.0 /100 | #85 | Exceptional 5.7% |
| Latvians | 99.0 /100 | #86 | Exceptional 5.7% |
| Immigrants | Chile | 98.9 /100 | #87 | Exceptional 5.8% |
| Soviet Union | 98.9 /100 | #88 | Exceptional 5.8% |
| Bhutanese | 98.8 /100 | #89 | Exceptional 5.8% |
| Australians | 98.8 /100 | #90 | Exceptional 5.8% |
| Immigrants | Sudan | 98.8 /100 | #91 | Exceptional 5.8% |
| Immigrants | Sierra Leone | 98.6 /100 | #92 | Exceptional 5.8% |
| Immigrants | Denmark | 98.6 /100 | #93 | Exceptional 5.8% |
| Kenyans | 98.4 /100 | #94 | Exceptional 5.8% |
| Immigrants | El Salvador | 98.4 /100 | #95 | Exceptional 5.8% |
| Salvadorans | 98.4 /100 | #96 | Exceptional 5.8% |