Spanish American Indian vs Asian Unemployment Among Ages 25 to 29 years
COMPARE
Spanish American Indian
Asian
Unemployment Among Ages 25 to 29 years
Unemployment Among Ages 25 to 29 years Comparison
Spanish American Indians
Asians
7.1%
UNEMPLOYMENT AMONG AGES 25 TO 29 YEARS
1.1/ 100
METRIC RATING
242nd/ 347
METRIC RANK
6.3%
UNEMPLOYMENT AMONG AGES 25 TO 29 YEARS
96.4/ 100
METRIC RATING
78th/ 347
METRIC RANK
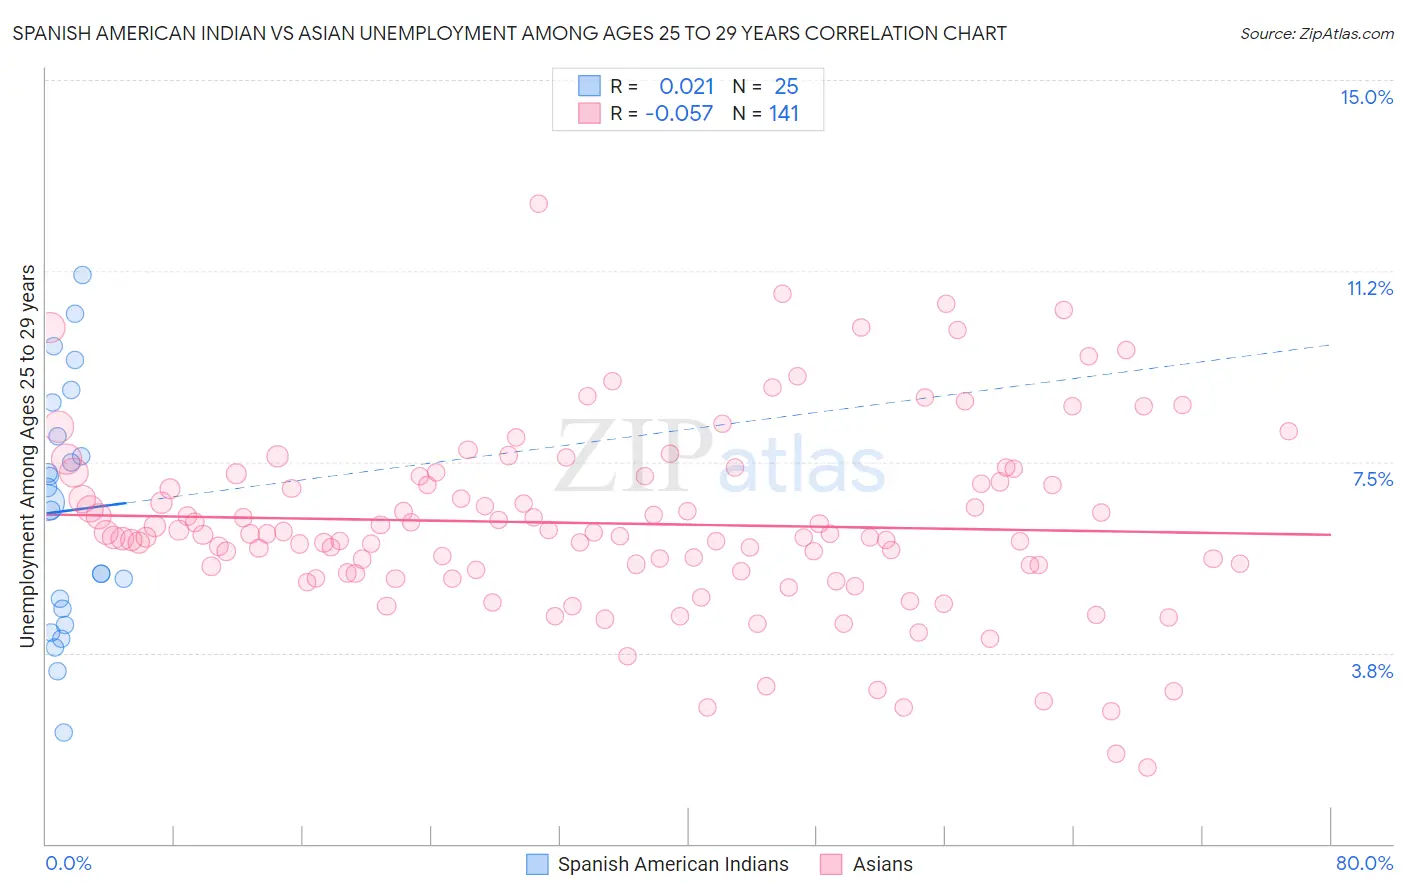
Spanish American Indian vs Asian Unemployment Among Ages 25 to 29 years Correlation Chart
The statistical analysis conducted on geographies consisting of 72,626,200 people shows no correlation between the proportion of Spanish American Indians and unemployment rate among population between the ages 25 and 29 in the United States with a correlation coefficient (R) of 0.021 and weighted average of 7.1%. Similarly, the statistical analysis conducted on geographies consisting of 498,860,275 people shows a slight negative correlation between the proportion of Asians and unemployment rate among population between the ages 25 and 29 in the United States with a correlation coefficient (R) of -0.057 and weighted average of 6.3%, a difference of 12.7%.
Unemployment Among Ages 25 to 29 years Correlation Summary
| Measurement | Spanish American Indian | Asian |
| Minimum | 2.2% | 1.5% |
| Maximum | 11.2% | 12.6% |
| Range | 9.0% | 11.1% |
| Mean | 6.5% | 6.3% |
| Median | 6.7% | 6.1% |
| Interquartile 25% (IQ1) | 4.5% | 5.4% |
| Interquartile 75% (IQ3) | 8.3% | 7.2% |
| Interquartile Range (IQR) | 3.9% | 1.8% |
| Standard Deviation (Sample) | 2.4% | 1.8% |
| Standard Deviation (Population) | 2.3% | 1.8% |
Similar Demographics by Unemployment Among Ages 25 to 29 years
Demographics Similar to Spanish American Indians by Unemployment Among Ages 25 to 29 years
In terms of unemployment among ages 25 to 29 years, the demographic groups most similar to Spanish American Indians are Yaqui (7.1%, a difference of 0.13%), Nonimmigrants (7.1%, a difference of 0.16%), Immigrants from Sierra Leone (7.1%, a difference of 0.26%), Guatemalan (7.1%, a difference of 0.26%), and Native Hawaiian (7.1%, a difference of 0.30%).
| Demographics | Rating | Rank | Unemployment Among Ages 25 to 29 years |
| Panamanians | 2.1 /100 | #235 | Tragic 7.0% |
| Cape Verdeans | 1.9 /100 | #236 | Tragic 7.0% |
| Puget Sound Salish | 1.8 /100 | #237 | Tragic 7.1% |
| Hondurans | 1.8 /100 | #238 | Tragic 7.1% |
| Potawatomi | 1.3 /100 | #239 | Tragic 7.1% |
| Native Hawaiians | 1.3 /100 | #240 | Tragic 7.1% |
| Immigrants | Sierra Leone | 1.3 /100 | #241 | Tragic 7.1% |
| Spanish American Indians | 1.1 /100 | #242 | Tragic 7.1% |
| Yaqui | 1.0 /100 | #243 | Tragic 7.1% |
| Immigrants | Nonimmigrants | 0.9 /100 | #244 | Tragic 7.1% |
| Guatemalans | 0.9 /100 | #245 | Tragic 7.1% |
| Immigrants | Uzbekistan | 0.7 /100 | #246 | Tragic 7.2% |
| Immigrants | Guatemala | 0.7 /100 | #247 | Tragic 7.2% |
| Sub-Saharan Africans | 0.6 /100 | #248 | Tragic 7.2% |
| Seminole | 0.6 /100 | #249 | Tragic 7.2% |
Demographics Similar to Asians by Unemployment Among Ages 25 to 29 years
In terms of unemployment among ages 25 to 29 years, the demographic groups most similar to Asians are Icelander (6.3%, a difference of 0.10%), Immigrants from Korea (6.3%, a difference of 0.12%), Immigrants from Switzerland (6.3%, a difference of 0.17%), Immigrants from Jordan (6.3%, a difference of 0.18%), and Immigrants from Romania (6.3%, a difference of 0.24%).
| Demographics | Rating | Rank | Unemployment Among Ages 25 to 29 years |
| Immigrants | France | 97.4 /100 | #71 | Exceptional 6.3% |
| Scandinavians | 97.4 /100 | #72 | Exceptional 6.3% |
| Belgians | 97.0 /100 | #73 | Exceptional 6.3% |
| Carpatho Rusyns | 96.9 /100 | #74 | Exceptional 6.3% |
| Immigrants | Jordan | 96.8 /100 | #75 | Exceptional 6.3% |
| Immigrants | Korea | 96.7 /100 | #76 | Exceptional 6.3% |
| Icelanders | 96.6 /100 | #77 | Exceptional 6.3% |
| Asians | 96.4 /100 | #78 | Exceptional 6.3% |
| Immigrants | Switzerland | 96.0 /100 | #79 | Exceptional 6.3% |
| Immigrants | Romania | 95.9 /100 | #80 | Exceptional 6.3% |
| Iranians | 95.8 /100 | #81 | Exceptional 6.3% |
| Immigrants | Poland | 95.7 /100 | #82 | Exceptional 6.3% |
| Slovenes | 95.3 /100 | #83 | Exceptional 6.3% |
| Immigrants | Spain | 95.2 /100 | #84 | Exceptional 6.3% |
| Immigrants | Sweden | 95.1 /100 | #85 | Exceptional 6.3% |