Native Hawaiian vs Albanian Disability
COMPARE
Native Hawaiian
Albanian
Disability
Disability Comparison
Native Hawaiians
Albanians
12.5%
DISABILITY
0.3/ 100
METRIC RATING
262nd/ 347
METRIC RANK
11.7%
DISABILITY
50.0/ 100
METRIC RATING
174th/ 347
METRIC RANK
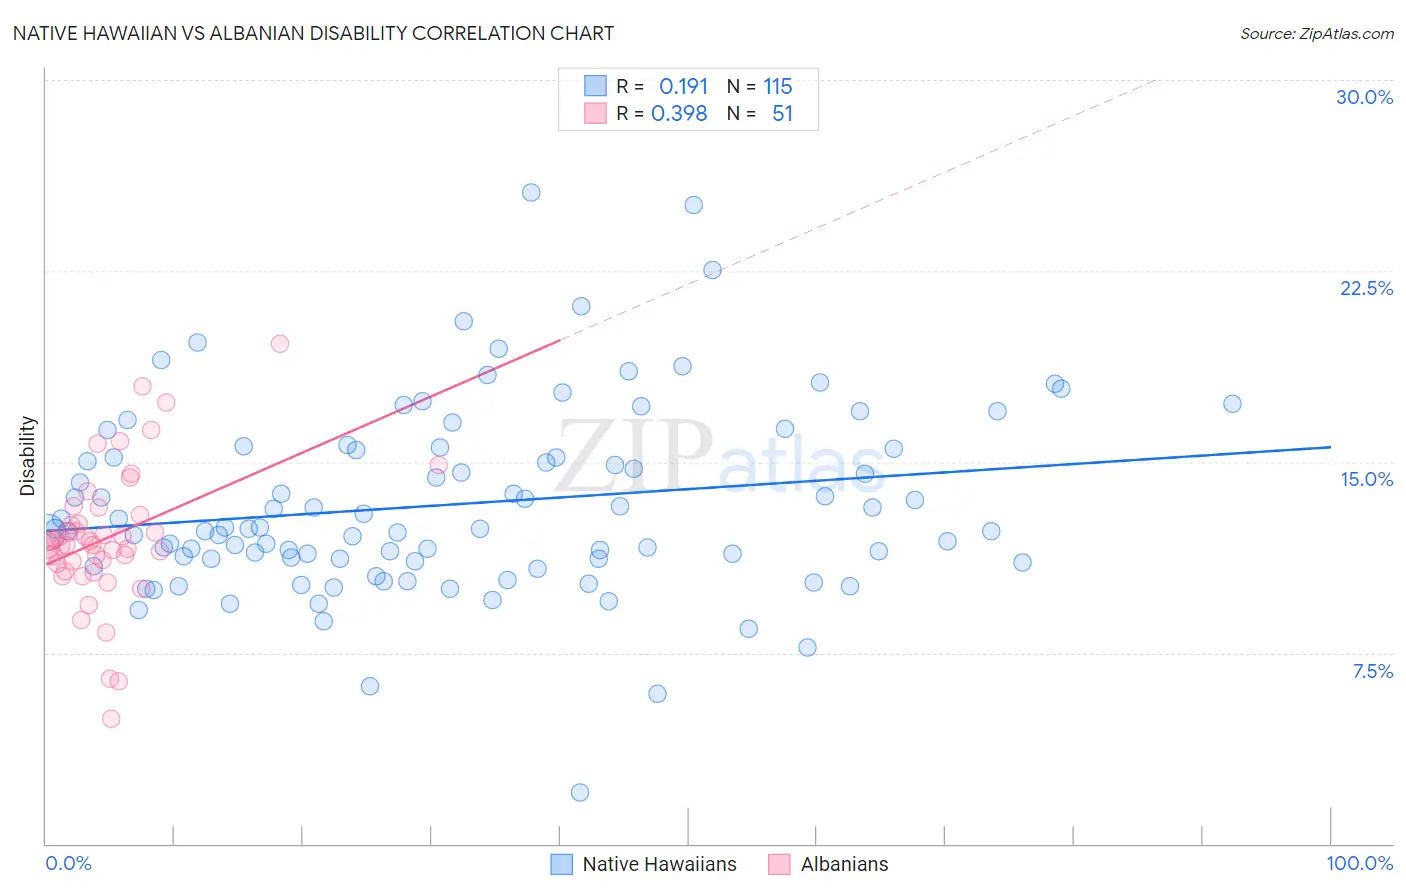
Native Hawaiian vs Albanian Disability Correlation Chart
The statistical analysis conducted on geographies consisting of 332,036,989 people shows a poor positive correlation between the proportion of Native Hawaiians and percentage of population with a disability in the United States with a correlation coefficient (R) of 0.191 and weighted average of 12.5%. Similarly, the statistical analysis conducted on geographies consisting of 193,262,883 people shows a mild positive correlation between the proportion of Albanians and percentage of population with a disability in the United States with a correlation coefficient (R) of 0.398 and weighted average of 11.7%, a difference of 6.4%.
Disability Correlation Summary
| Measurement | Native Hawaiian | Albanian |
| Minimum | 2.0% | 4.9% |
| Maximum | 25.6% | 19.7% |
| Range | 23.6% | 14.8% |
| Mean | 13.3% | 12.0% |
| Median | 12.4% | 11.7% |
| Interquartile 25% (IQ1) | 11.2% | 11.0% |
| Interquartile 75% (IQ3) | 15.5% | 12.9% |
| Interquartile Range (IQR) | 4.4% | 1.9% |
| Standard Deviation (Sample) | 3.7% | 2.7% |
| Standard Deviation (Population) | 3.7% | 2.7% |
Similar Demographics by Disability
Demographics Similar to Native Hawaiians by Disability
In terms of disability, the demographic groups most similar to Native Hawaiians are Hawaiian (12.5%, a difference of 0.20%), Scandinavian (12.4%, a difference of 0.27%), Immigrants from Germany (12.5%, a difference of 0.32%), U.S. Virgin Islander (12.5%, a difference of 0.33%), and Immigrants from Liberia (12.4%, a difference of 0.34%).
| Demographics | Rating | Rank | Disability |
| Slovenes | 0.6 /100 | #255 | Tragic 12.4% |
| Immigrants | Dominica | 0.6 /100 | #256 | Tragic 12.4% |
| Immigrants | Laos | 0.5 /100 | #257 | Tragic 12.4% |
| Slavs | 0.5 /100 | #258 | Tragic 12.4% |
| Canadians | 0.4 /100 | #259 | Tragic 12.4% |
| Immigrants | Liberia | 0.4 /100 | #260 | Tragic 12.4% |
| Scandinavians | 0.4 /100 | #261 | Tragic 12.4% |
| Native Hawaiians | 0.3 /100 | #262 | Tragic 12.5% |
| Hawaiians | 0.2 /100 | #263 | Tragic 12.5% |
| Immigrants | Germany | 0.2 /100 | #264 | Tragic 12.5% |
| U.S. Virgin Islanders | 0.2 /100 | #265 | Tragic 12.5% |
| Czechoslovakians | 0.2 /100 | #266 | Tragic 12.5% |
| Spaniards | 0.2 /100 | #267 | Tragic 12.5% |
| Bangladeshis | 0.1 /100 | #268 | Tragic 12.6% |
| Immigrants | Dominican Republic | 0.1 /100 | #269 | Tragic 12.6% |
Demographics Similar to Albanians by Disability
In terms of disability, the demographic groups most similar to Albanians are Maltese (11.7%, a difference of 0.030%), Haitian (11.7%, a difference of 0.060%), Immigrants from Western Africa (11.7%, a difference of 0.11%), Immigrants from Albania (11.7%, a difference of 0.12%), and Immigrants from Southern Europe (11.7%, a difference of 0.12%).
| Demographics | Rating | Rank | Disability |
| Estonians | 54.4 /100 | #167 | Average 11.7% |
| Immigrants | Latin America | 54.1 /100 | #168 | Average 11.7% |
| Immigrants | Austria | 53.4 /100 | #169 | Average 11.7% |
| Immigrants | Albania | 52.8 /100 | #170 | Average 11.7% |
| Immigrants | Southern Europe | 52.8 /100 | #171 | Average 11.7% |
| Trinidadians and Tobagonians | 52.7 /100 | #172 | Average 11.7% |
| Maltese | 50.6 /100 | #173 | Average 11.7% |
| Albanians | 50.0 /100 | #174 | Average 11.7% |
| Haitians | 48.6 /100 | #175 | Average 11.7% |
| Immigrants | Western Africa | 47.5 /100 | #176 | Average 11.7% |
| Immigrants | Central America | 46.6 /100 | #177 | Average 11.7% |
| Greeks | 46.2 /100 | #178 | Average 11.7% |
| Immigrants | Armenia | 41.9 /100 | #179 | Average 11.7% |
| Immigrants | Honduras | 37.8 /100 | #180 | Fair 11.8% |
| Immigrants | Oceania | 34.3 /100 | #181 | Fair 11.8% |