Puget Sound Salish vs Taiwanese Cognitive Disability
COMPARE
Puget Sound Salish
Taiwanese
Cognitive Disability
Cognitive Disability Comparison
Puget Sound Salish
Taiwanese
17.5%
COGNITIVE DISABILITY
10.9/ 100
METRIC RATING
205th/ 347
METRIC RANK
17.6%
COGNITIVE DISABILITY
7.7/ 100
METRIC RATING
211th/ 347
METRIC RANK
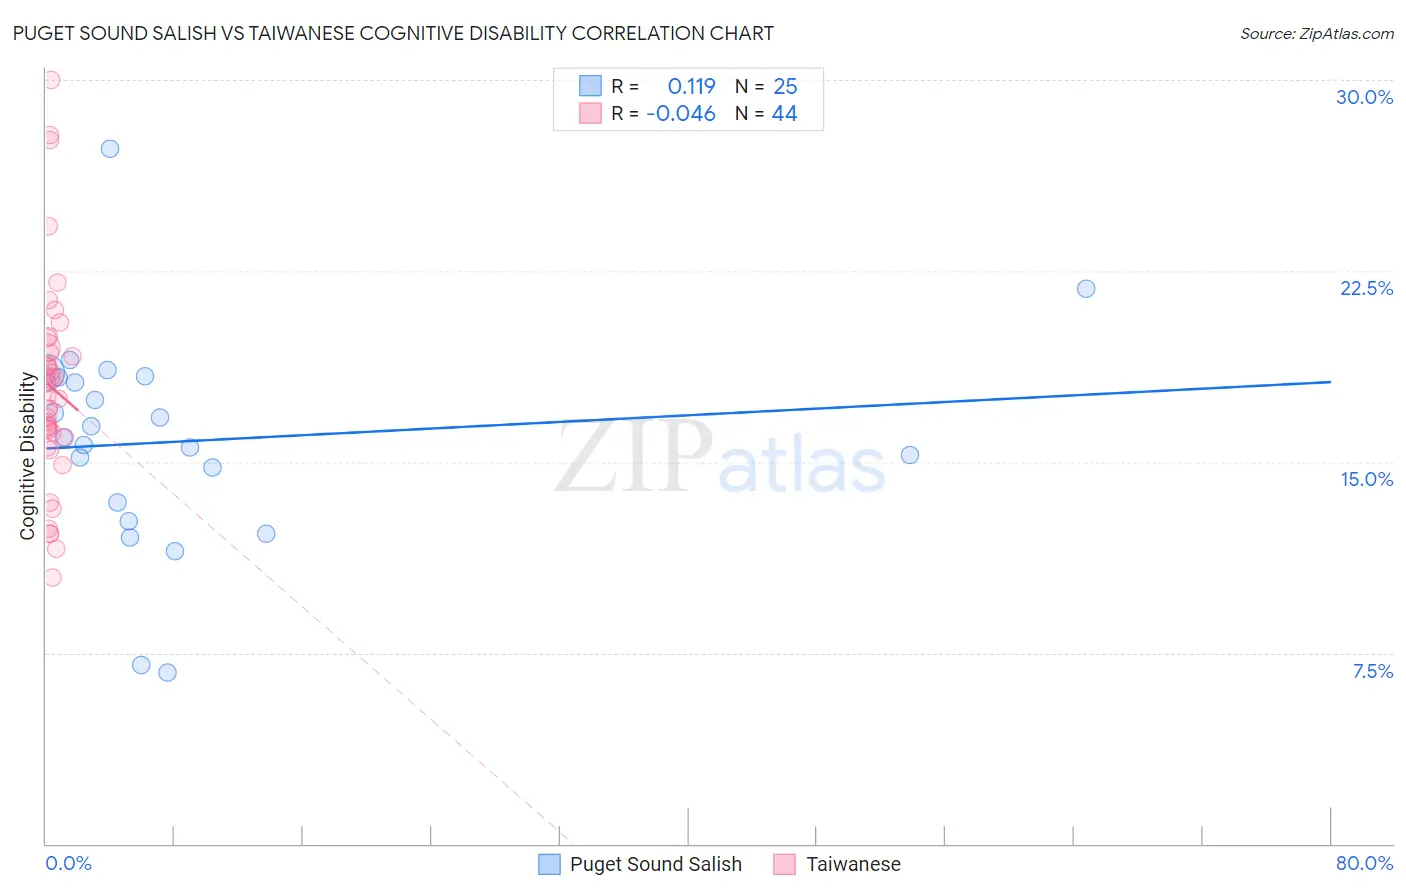
Puget Sound Salish vs Taiwanese Cognitive Disability Correlation Chart
The statistical analysis conducted on geographies consisting of 46,155,775 people shows a poor positive correlation between the proportion of Puget Sound Salish and percentage of population with cognitive disability in the United States with a correlation coefficient (R) of 0.119 and weighted average of 17.5%. Similarly, the statistical analysis conducted on geographies consisting of 31,724,936 people shows no correlation between the proportion of Taiwanese and percentage of population with cognitive disability in the United States with a correlation coefficient (R) of -0.046 and weighted average of 17.6%, a difference of 0.26%.
Cognitive Disability Correlation Summary
| Measurement | Puget Sound Salish | Taiwanese |
| Minimum | 6.7% | 10.5% |
| Maximum | 27.3% | 30.0% |
| Range | 20.6% | 19.5% |
| Mean | 15.8% | 17.9% |
| Median | 16.0% | 17.8% |
| Interquartile 25% (IQ1) | 13.0% | 16.1% |
| Interquartile 75% (IQ3) | 18.3% | 19.4% |
| Interquartile Range (IQR) | 5.3% | 3.3% |
| Standard Deviation (Sample) | 4.3% | 4.1% |
| Standard Deviation (Population) | 4.2% | 4.0% |
Demographics Similar to Puget Sound Salish and Taiwanese by Cognitive Disability
In terms of cognitive disability, the demographic groups most similar to Puget Sound Salish are Immigrants from Caribbean (17.5%, a difference of 0.010%), Immigrants from Zimbabwe (17.5%, a difference of 0.010%), Alaska Native (17.5%, a difference of 0.040%), Immigrants from Morocco (17.5%, a difference of 0.080%), and Immigrants from Latin America (17.6%, a difference of 0.090%). Similarly, the demographic groups most similar to Taiwanese are Immigrants from Oceania (17.6%, a difference of 0.040%), Hawaiian (17.6%, a difference of 0.050%), Immigrants from Jamaica (17.6%, a difference of 0.070%), Immigrants from El Salvador (17.6%, a difference of 0.080%), and Immigrants from Trinidad and Tobago (17.6%, a difference of 0.090%).
| Demographics | Rating | Rank | Cognitive Disability |
| Immigrants | Panama | 14.8 /100 | #198 | Poor 17.5% |
| Immigrants | Singapore | 14.3 /100 | #199 | Poor 17.5% |
| Haitians | 14.1 /100 | #200 | Poor 17.5% |
| South American Indians | 13.0 /100 | #201 | Poor 17.5% |
| Immigrants | Morocco | 12.0 /100 | #202 | Poor 17.5% |
| Immigrants | Caribbean | 11.0 /100 | #203 | Poor 17.5% |
| Immigrants | Zimbabwe | 11.0 /100 | #204 | Poor 17.5% |
| Puget Sound Salish | 10.9 /100 | #205 | Poor 17.5% |
| Alaska Natives | 10.4 /100 | #206 | Poor 17.5% |
| Immigrants | Latin America | 9.7 /100 | #207 | Tragic 17.6% |
| Immigrants | Cameroon | 9.3 /100 | #208 | Tragic 17.6% |
| Immigrants | Trinidad and Tobago | 8.7 /100 | #209 | Tragic 17.6% |
| Immigrants | Jamaica | 8.5 /100 | #210 | Tragic 17.6% |
| Taiwanese | 7.7 /100 | #211 | Tragic 17.6% |
| Immigrants | Oceania | 7.3 /100 | #212 | Tragic 17.6% |
| Hawaiians | 7.2 /100 | #213 | Tragic 17.6% |
| Immigrants | El Salvador | 7.0 /100 | #214 | Tragic 17.6% |
| Alaskan Athabascans | 6.9 /100 | #215 | Tragic 17.6% |
| Okinawans | 6.8 /100 | #216 | Tragic 17.6% |
| Salvadorans | 6.7 /100 | #217 | Tragic 17.6% |
| Icelanders | 6.4 /100 | #218 | Tragic 17.6% |