Chilean vs Taiwanese Cognitive Disability
COMPARE
Chilean
Taiwanese
Cognitive Disability
Cognitive Disability Comparison
Chileans
Taiwanese
17.0%
COGNITIVE DISABILITY
89.9/ 100
METRIC RATING
140th/ 347
METRIC RANK
17.6%
COGNITIVE DISABILITY
7.7/ 100
METRIC RATING
211th/ 347
METRIC RANK
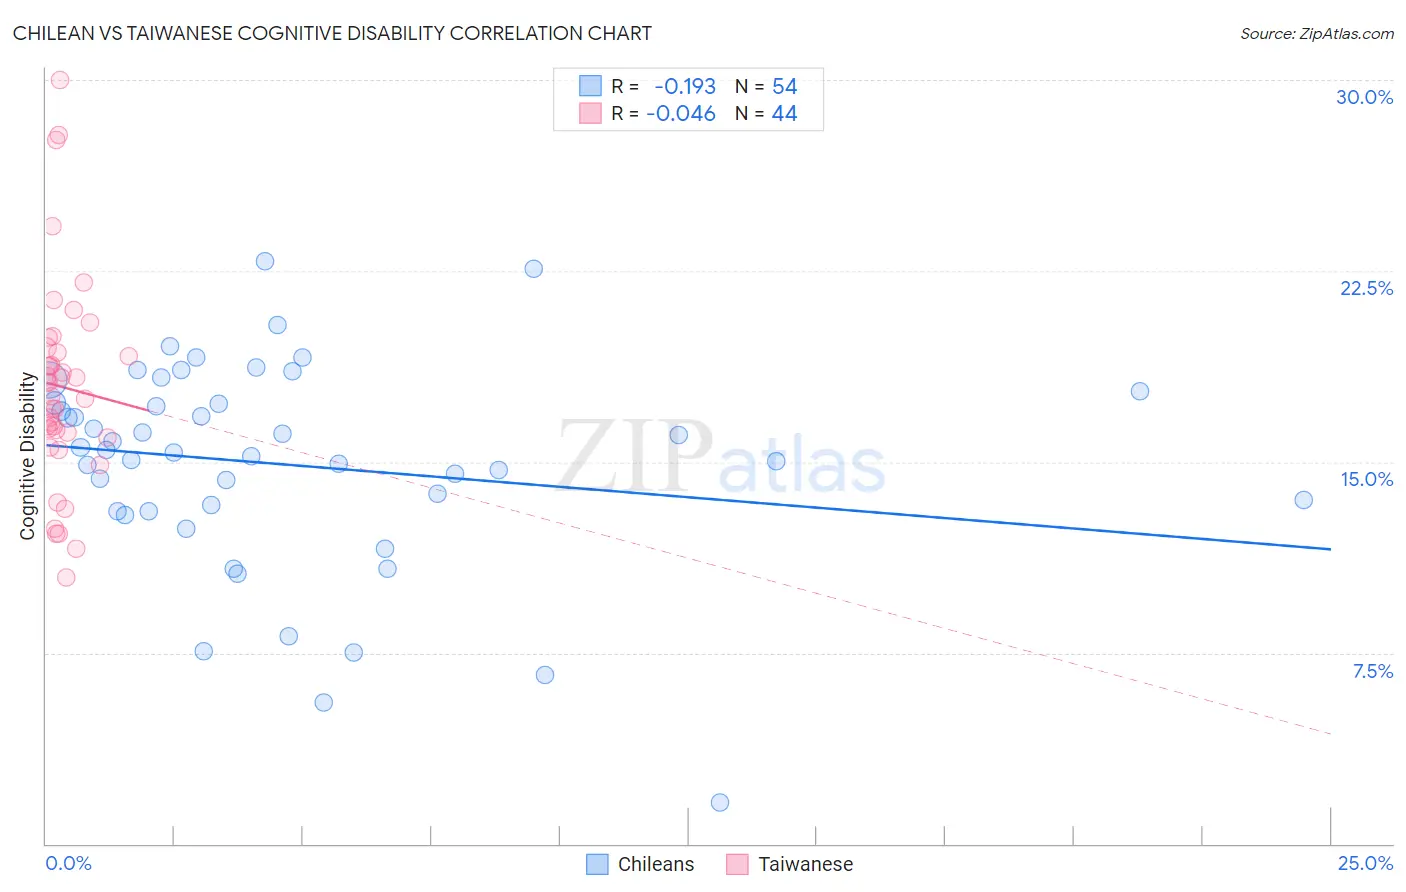
Chilean vs Taiwanese Cognitive Disability Correlation Chart
The statistical analysis conducted on geographies consisting of 256,654,353 people shows a poor negative correlation between the proportion of Chileans and percentage of population with cognitive disability in the United States with a correlation coefficient (R) of -0.193 and weighted average of 17.0%. Similarly, the statistical analysis conducted on geographies consisting of 31,724,936 people shows no correlation between the proportion of Taiwanese and percentage of population with cognitive disability in the United States with a correlation coefficient (R) of -0.046 and weighted average of 17.6%, a difference of 3.4%.
Cognitive Disability Correlation Summary
| Measurement | Chilean | Taiwanese |
| Minimum | 1.6% | 10.5% |
| Maximum | 22.9% | 30.0% |
| Range | 21.3% | 19.5% |
| Mean | 14.9% | 17.9% |
| Median | 15.4% | 17.8% |
| Interquartile 25% (IQ1) | 13.1% | 16.1% |
| Interquartile 75% (IQ3) | 17.3% | 19.4% |
| Interquartile Range (IQR) | 4.2% | 3.3% |
| Standard Deviation (Sample) | 4.1% | 4.1% |
| Standard Deviation (Population) | 4.1% | 4.0% |
Similar Demographics by Cognitive Disability
Demographics Similar to Chileans by Cognitive Disability
In terms of cognitive disability, the demographic groups most similar to Chileans are French (17.0%, a difference of 0.0%), Aleut (17.0%, a difference of 0.0%), Carpatho Rusyn (17.0%, a difference of 0.030%), British (17.0%, a difference of 0.050%), and Immigrants from Brazil (17.0%, a difference of 0.050%).
| Demographics | Rating | Rank | Cognitive Disability |
| Immigrants | Jordan | 91.9 /100 | #133 | Exceptional 17.0% |
| Immigrants | Chile | 91.7 /100 | #134 | Exceptional 17.0% |
| Lebanese | 91.3 /100 | #135 | Exceptional 17.0% |
| Israelis | 91.0 /100 | #136 | Exceptional 17.0% |
| Immigrants | Norway | 90.9 /100 | #137 | Exceptional 17.0% |
| Welsh | 90.8 /100 | #138 | Exceptional 17.0% |
| French | 90.0 /100 | #139 | Excellent 17.0% |
| Chileans | 89.9 /100 | #140 | Excellent 17.0% |
| Aleuts | 89.9 /100 | #141 | Excellent 17.0% |
| Carpatho Rusyns | 89.6 /100 | #142 | Excellent 17.0% |
| British | 89.3 /100 | #143 | Excellent 17.0% |
| Immigrants | Brazil | 89.3 /100 | #144 | Excellent 17.0% |
| Immigrants | South Eastern Asia | 88.7 /100 | #145 | Excellent 17.0% |
| Costa Ricans | 88.0 /100 | #146 | Excellent 17.0% |
| Scotch-Irish | 85.9 /100 | #147 | Excellent 17.1% |
Demographics Similar to Taiwanese by Cognitive Disability
In terms of cognitive disability, the demographic groups most similar to Taiwanese are Immigrants from Oceania (17.6%, a difference of 0.040%), Hawaiian (17.6%, a difference of 0.050%), Immigrants from Jamaica (17.6%, a difference of 0.070%), Immigrants from El Salvador (17.6%, a difference of 0.080%), and Immigrants from Trinidad and Tobago (17.6%, a difference of 0.090%).
| Demographics | Rating | Rank | Cognitive Disability |
| Immigrants | Zimbabwe | 11.0 /100 | #204 | Poor 17.5% |
| Puget Sound Salish | 10.9 /100 | #205 | Poor 17.5% |
| Alaska Natives | 10.4 /100 | #206 | Poor 17.5% |
| Immigrants | Latin America | 9.7 /100 | #207 | Tragic 17.6% |
| Immigrants | Cameroon | 9.3 /100 | #208 | Tragic 17.6% |
| Immigrants | Trinidad and Tobago | 8.7 /100 | #209 | Tragic 17.6% |
| Immigrants | Jamaica | 8.5 /100 | #210 | Tragic 17.6% |
| Taiwanese | 7.7 /100 | #211 | Tragic 17.6% |
| Immigrants | Oceania | 7.3 /100 | #212 | Tragic 17.6% |
| Hawaiians | 7.2 /100 | #213 | Tragic 17.6% |
| Immigrants | El Salvador | 7.0 /100 | #214 | Tragic 17.6% |
| Alaskan Athabascans | 6.9 /100 | #215 | Tragic 17.6% |
| Okinawans | 6.8 /100 | #216 | Tragic 17.6% |
| Salvadorans | 6.7 /100 | #217 | Tragic 17.6% |
| Icelanders | 6.4 /100 | #218 | Tragic 17.6% |