Soviet Union vs Ecuadorian In Labor Force | Age 25-29
COMPARE
Soviet Union
Ecuadorian
In Labor Force | Age 25-29
In Labor Force | Age 25-29 Comparison
Soviet Union
Ecuadorians
85.3%
IN LABOR FORCE | AGE 25-29
98.5/ 100
METRIC RATING
74th/ 347
METRIC RANK
84.4%
IN LABOR FORCE | AGE 25-29
14.8/ 100
METRIC RATING
205th/ 347
METRIC RANK
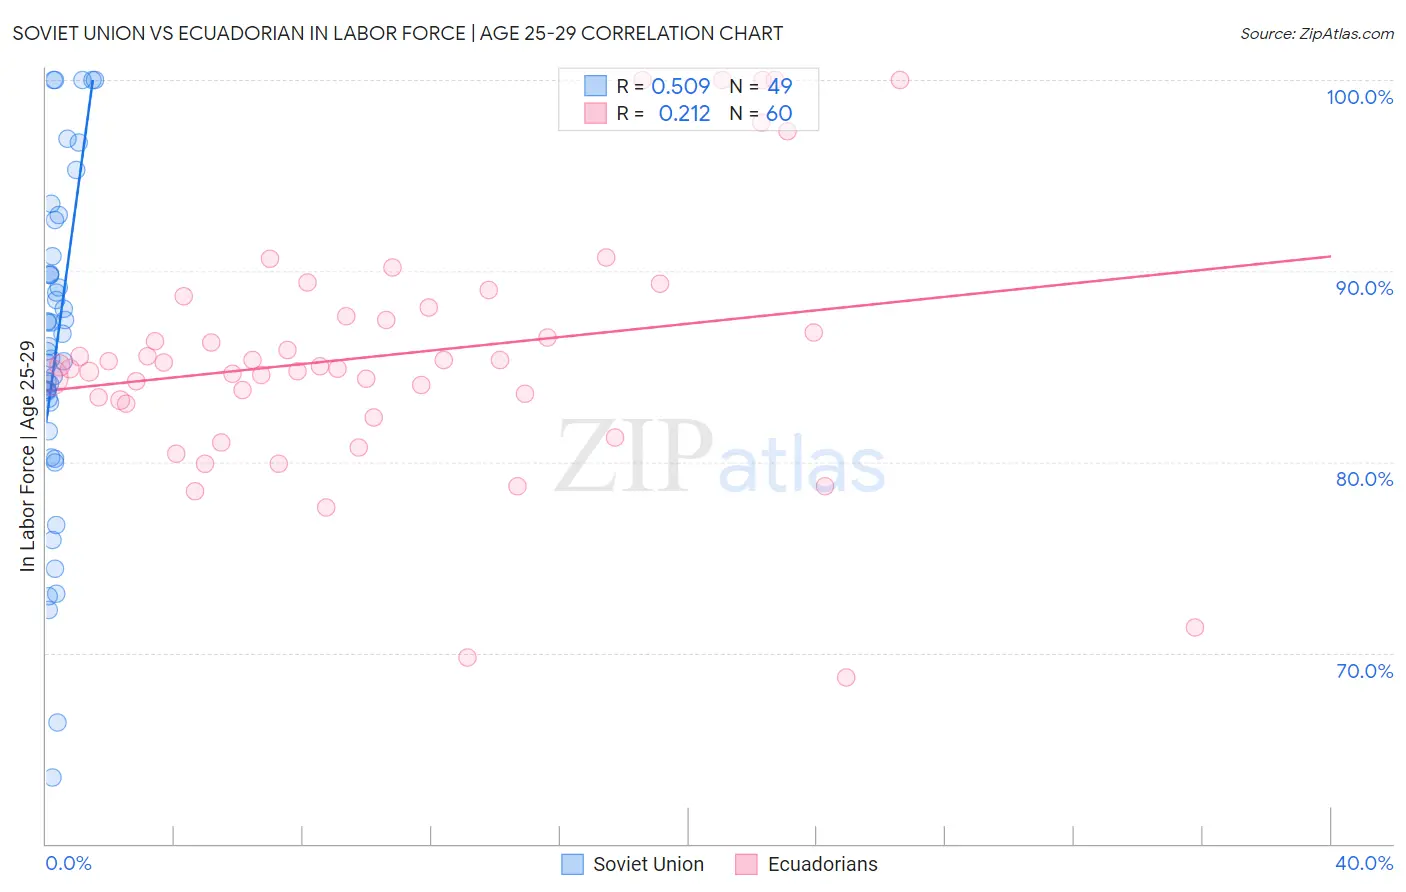
Soviet Union vs Ecuadorian In Labor Force | Age 25-29 Correlation Chart
The statistical analysis conducted on geographies consisting of 43,504,224 people shows a substantial positive correlation between the proportion of Soviet Union and labor force participation rate among population between the ages 25 and 29 in the United States with a correlation coefficient (R) of 0.509 and weighted average of 85.3%. Similarly, the statistical analysis conducted on geographies consisting of 317,761,699 people shows a weak positive correlation between the proportion of Ecuadorians and labor force participation rate among population between the ages 25 and 29 in the United States with a correlation coefficient (R) of 0.212 and weighted average of 84.4%, a difference of 1.1%.
In Labor Force | Age 25-29 Correlation Summary
| Measurement | Soviet Union | Ecuadorian |
| Minimum | 63.5% | 68.7% |
| Maximum | 100.0% | 100.0% |
| Range | 36.5% | 31.3% |
| Mean | 86.0% | 85.6% |
| Median | 86.1% | 85.0% |
| Interquartile 25% (IQ1) | 82.3% | 83.1% |
| Interquartile 75% (IQ3) | 90.3% | 87.8% |
| Interquartile Range (IQR) | 8.0% | 4.7% |
| Standard Deviation (Sample) | 8.5% | 6.7% |
| Standard Deviation (Population) | 8.4% | 6.6% |
Similar Demographics by In Labor Force | Age 25-29
Demographics Similar to Soviet Union by In Labor Force | Age 25-29
In terms of in labor force | age 25-29, the demographic groups most similar to Soviet Union are Brazilian (85.3%, a difference of 0.030%), Russian (85.3%, a difference of 0.040%), Immigrants from Australia (85.3%, a difference of 0.050%), German (85.3%, a difference of 0.050%), and Kenyan (85.4%, a difference of 0.070%).
| Demographics | Rating | Rank | In Labor Force | Age 25-29 |
| Immigrants | Turkey | 99.2 /100 | #67 | Exceptional 85.4% |
| Immigrants | Cameroon | 99.2 /100 | #68 | Exceptional 85.4% |
| Menominee | 99.1 /100 | #69 | Exceptional 85.4% |
| Immigrants | Sweden | 99.1 /100 | #70 | Exceptional 85.4% |
| Kenyans | 99.0 /100 | #71 | Exceptional 85.4% |
| Immigrants | Australia | 98.9 /100 | #72 | Exceptional 85.3% |
| Russians | 98.8 /100 | #73 | Exceptional 85.3% |
| Soviet Union | 98.5 /100 | #74 | Exceptional 85.3% |
| Brazilians | 98.3 /100 | #75 | Exceptional 85.3% |
| Germans | 98.1 /100 | #76 | Exceptional 85.3% |
| Immigrants | South Central Asia | 97.9 /100 | #77 | Exceptional 85.2% |
| Immigrants | Egypt | 97.7 /100 | #78 | Exceptional 85.2% |
| Immigrants | Northern Africa | 97.6 /100 | #79 | Exceptional 85.2% |
| Immigrants | Zimbabwe | 97.6 /100 | #80 | Exceptional 85.2% |
| Immigrants | Northern Europe | 97.2 /100 | #81 | Exceptional 85.2% |
Demographics Similar to Ecuadorians by In Labor Force | Age 25-29
In terms of in labor force | age 25-29, the demographic groups most similar to Ecuadorians are Venezuelan (84.4%, a difference of 0.0%), Immigrants from Afghanistan (84.4%, a difference of 0.010%), Immigrants from Cambodia (84.4%, a difference of 0.010%), Laotian (84.4%, a difference of 0.020%), and Afghan (84.4%, a difference of 0.020%).
| Demographics | Rating | Rank | In Labor Force | Age 25-29 |
| Immigrants | Iraq | 19.0 /100 | #198 | Poor 84.4% |
| Immigrants | Germany | 18.3 /100 | #199 | Poor 84.4% |
| Immigrants | Kazakhstan | 17.5 /100 | #200 | Poor 84.4% |
| Laotians | 16.6 /100 | #201 | Poor 84.4% |
| Afghans | 15.9 /100 | #202 | Poor 84.4% |
| Immigrants | Afghanistan | 15.6 /100 | #203 | Poor 84.4% |
| Venezuelans | 15.1 /100 | #204 | Poor 84.4% |
| Ecuadorians | 14.8 /100 | #205 | Poor 84.4% |
| Immigrants | Cambodia | 14.3 /100 | #206 | Poor 84.4% |
| Immigrants | Armenia | 13.3 /100 | #207 | Poor 84.4% |
| Immigrants | Indonesia | 13.2 /100 | #208 | Poor 84.4% |
| Immigrants | Jordan | 12.8 /100 | #209 | Poor 84.4% |
| Chinese | 12.7 /100 | #210 | Poor 84.3% |
| Immigrants | Venezuela | 12.6 /100 | #211 | Poor 84.3% |
| Sub-Saharan Africans | 11.7 /100 | #212 | Poor 84.3% |