Soviet Union vs French American Indian Vision Disability
COMPARE
Soviet Union
French American Indian
Vision Disability
Vision Disability Comparison
Soviet Union
French American Indians
2.0%
VISION DISABILITY
97.6/ 100
METRIC RATING
81st/ 347
METRIC RANK
2.5%
VISION DISABILITY
0.0/ 100
METRIC RATING
288th/ 347
METRIC RANK
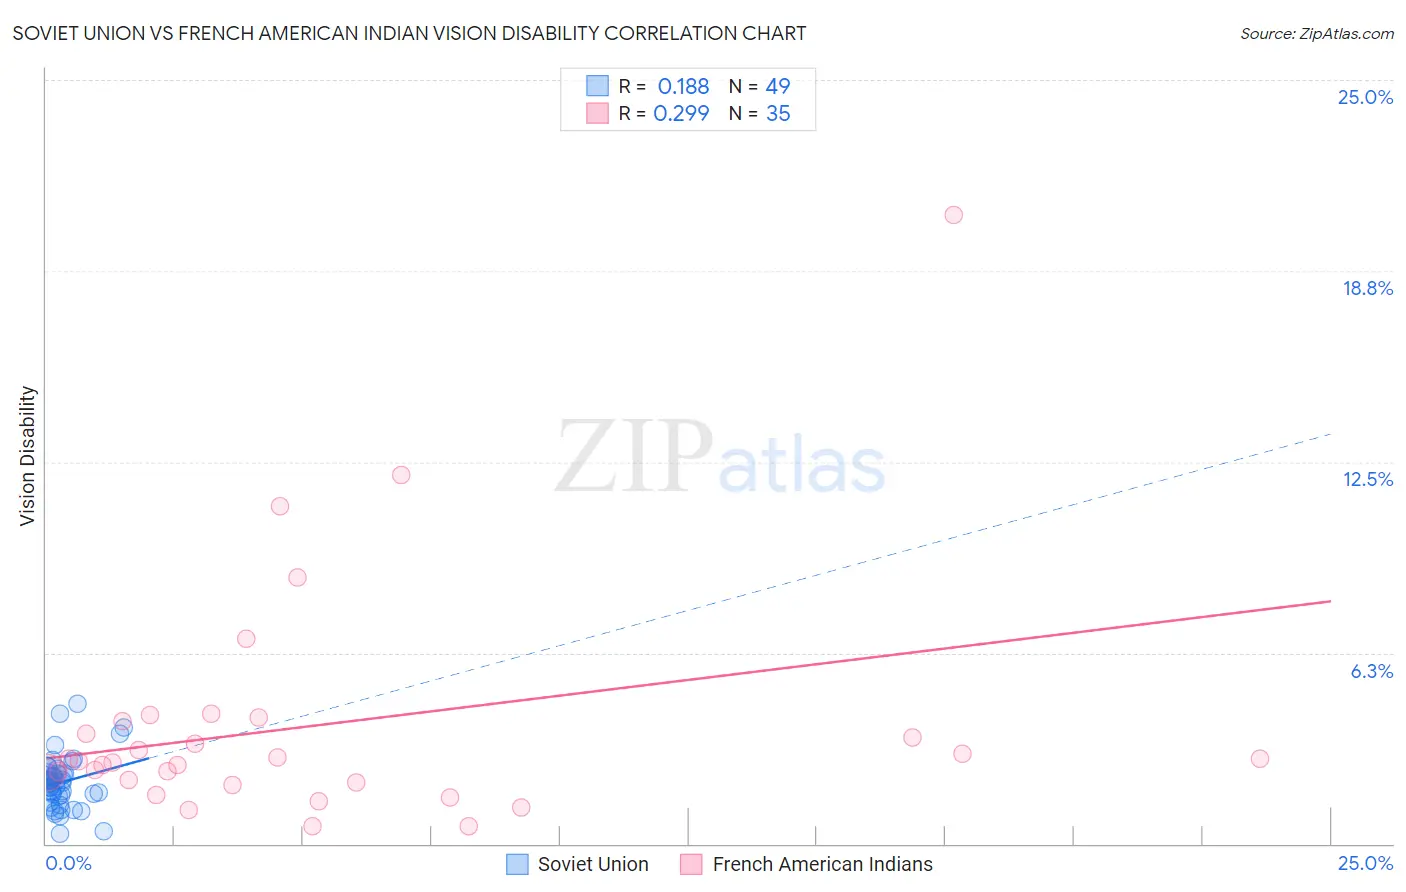
Soviet Union vs French American Indian Vision Disability Correlation Chart
The statistical analysis conducted on geographies consisting of 43,504,651 people shows a poor positive correlation between the proportion of Soviet Union and percentage of population with vision disability in the United States with a correlation coefficient (R) of 0.188 and weighted average of 2.0%. Similarly, the statistical analysis conducted on geographies consisting of 131,938,190 people shows a weak positive correlation between the proportion of French American Indians and percentage of population with vision disability in the United States with a correlation coefficient (R) of 0.299 and weighted average of 2.5%, a difference of 21.1%.
Vision Disability Correlation Summary
| Measurement | Soviet Union | French American Indian |
| Minimum | 0.35% | 0.57% |
| Maximum | 4.6% | 20.6% |
| Range | 4.2% | 20.0% |
| Mean | 2.0% | 3.8% |
| Median | 2.0% | 2.7% |
| Interquartile 25% (IQ1) | 1.6% | 2.0% |
| Interquartile 75% (IQ3) | 2.3% | 4.0% |
| Interquartile Range (IQR) | 0.72% | 2.0% |
| Standard Deviation (Sample) | 0.86% | 3.9% |
| Standard Deviation (Population) | 0.85% | 3.8% |
Similar Demographics by Vision Disability
Demographics Similar to Soviet Union by Vision Disability
In terms of vision disability, the demographic groups most similar to Soviet Union are Immigrants from Poland (2.0%, a difference of 0.020%), Lithuanian (2.0%, a difference of 0.060%), Immigrants from Western Asia (2.0%, a difference of 0.11%), Immigrants from Latvia (2.0%, a difference of 0.22%), and Chinese (2.0%, a difference of 0.28%).
| Demographics | Rating | Rank | Vision Disability |
| Palestinians | 98.3 /100 | #74 | Exceptional 2.0% |
| Immigrants | North Macedonia | 98.3 /100 | #75 | Exceptional 2.0% |
| Paraguayans | 98.3 /100 | #76 | Exceptional 2.0% |
| Immigrants | Jordan | 98.3 /100 | #77 | Exceptional 2.0% |
| Immigrants | Eastern Europe | 98.3 /100 | #78 | Exceptional 2.0% |
| Assyrians/Chaldeans/Syriacs | 98.1 /100 | #79 | Exceptional 2.0% |
| Lithuanians | 97.7 /100 | #80 | Exceptional 2.0% |
| Soviet Union | 97.6 /100 | #81 | Exceptional 2.0% |
| Immigrants | Poland | 97.6 /100 | #82 | Exceptional 2.0% |
| Immigrants | Western Asia | 97.5 /100 | #83 | Exceptional 2.0% |
| Immigrants | Latvia | 97.3 /100 | #84 | Exceptional 2.0% |
| Chinese | 97.2 /100 | #85 | Exceptional 2.0% |
| Immigrants | Moldova | 97.2 /100 | #86 | Exceptional 2.0% |
| Immigrants | Switzerland | 97.0 /100 | #87 | Exceptional 2.0% |
| Norwegians | 97.0 /100 | #88 | Exceptional 2.0% |
Demographics Similar to French American Indians by Vision Disability
In terms of vision disability, the demographic groups most similar to French American Indians are Honduran (2.5%, a difference of 0.020%), Sioux (2.5%, a difference of 0.17%), Immigrants from Central America (2.5%, a difference of 0.18%), Yakama (2.5%, a difference of 0.19%), and Nonimmigrants (2.5%, a difference of 0.41%).
| Demographics | Rating | Rank | Vision Disability |
| U.S. Virgin Islanders | 0.0 /100 | #281 | Tragic 2.5% |
| Immigrants | Caribbean | 0.0 /100 | #282 | Tragic 2.5% |
| Puget Sound Salish | 0.0 /100 | #283 | Tragic 2.5% |
| Yakama | 0.0 /100 | #284 | Tragic 2.5% |
| Immigrants | Central America | 0.0 /100 | #285 | Tragic 2.5% |
| Sioux | 0.0 /100 | #286 | Tragic 2.5% |
| Hondurans | 0.0 /100 | #287 | Tragic 2.5% |
| French American Indians | 0.0 /100 | #288 | Tragic 2.5% |
| Immigrants | Nonimmigrants | 0.0 /100 | #289 | Tragic 2.5% |
| Immigrants | Cuba | 0.0 /100 | #290 | Tragic 2.5% |
| Immigrants | Honduras | 0.0 /100 | #291 | Tragic 2.5% |
| Crow | 0.0 /100 | #292 | Tragic 2.5% |
| Yaqui | 0.0 /100 | #293 | Tragic 2.5% |
| Ottawa | 0.0 /100 | #294 | Tragic 2.5% |
| Delaware | 0.0 /100 | #295 | Tragic 2.5% |