South African vs Immigrants from Trinidad and Tobago Householder Income Over 65 years
COMPARE
South African
Immigrants from Trinidad and Tobago
Householder Income Over 65 years
Householder Income Over 65 years Comparison
South Africans
Immigrants from Trinidad and Tobago
$65,652
HOUSEHOLDER INCOME OVER 65 YEARS
99.3/ 100
METRIC RATING
66th/ 347
METRIC RANK
$55,598
HOUSEHOLDER INCOME OVER 65 YEARS
0.4/ 100
METRIC RATING
253rd/ 347
METRIC RANK
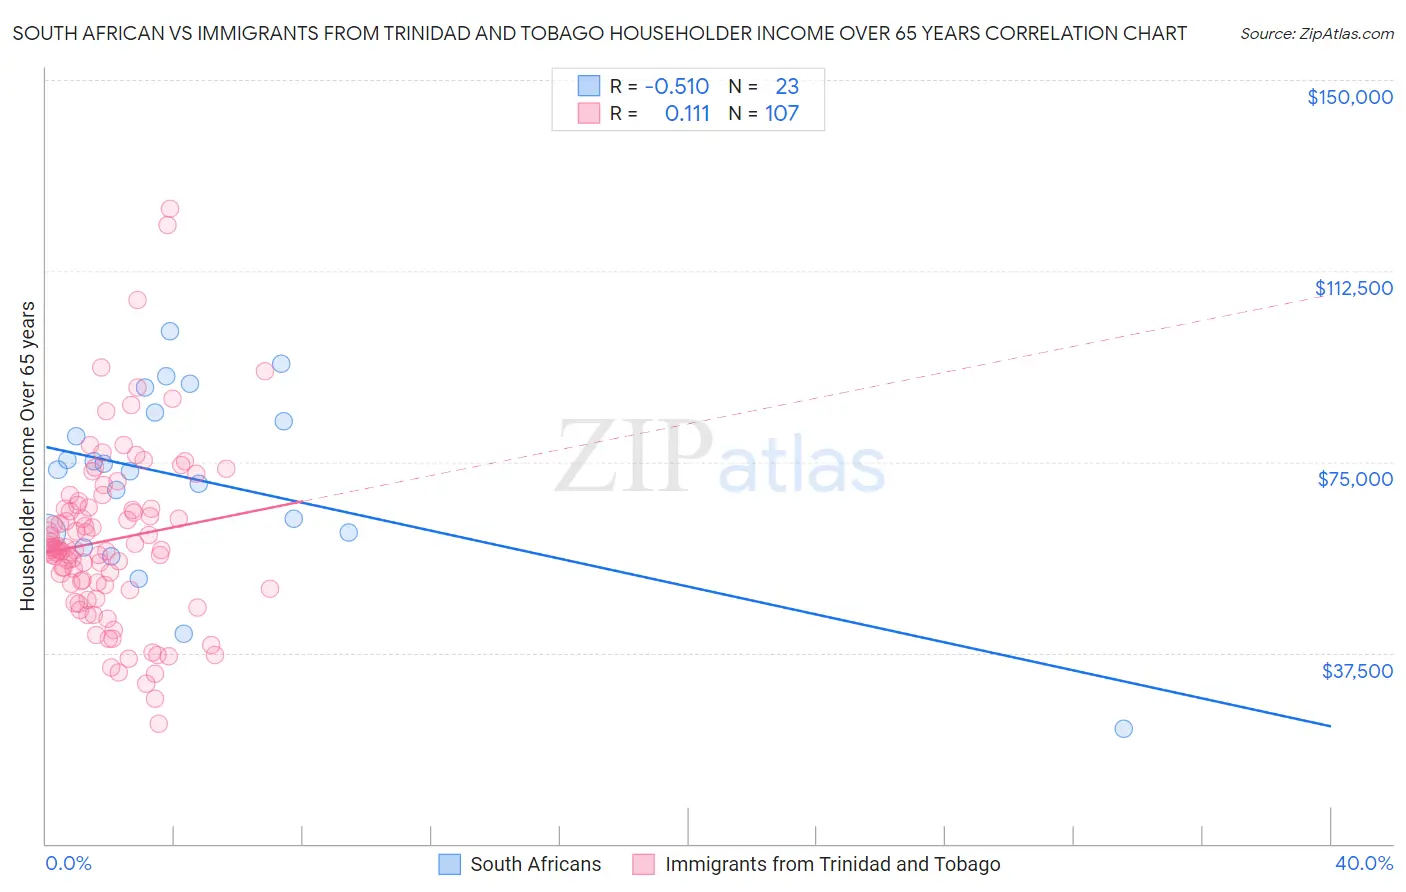
South African vs Immigrants from Trinidad and Tobago Householder Income Over 65 years Correlation Chart
The statistical analysis conducted on geographies consisting of 182,279,663 people shows a substantial negative correlation between the proportion of South Africans and household income with householder over the age of 65 in the United States with a correlation coefficient (R) of -0.510 and weighted average of $65,652. Similarly, the statistical analysis conducted on geographies consisting of 223,183,074 people shows a poor positive correlation between the proportion of Immigrants from Trinidad and Tobago and household income with householder over the age of 65 in the United States with a correlation coefficient (R) of 0.111 and weighted average of $55,598, a difference of 18.1%.
Householder Income Over 65 years Correlation Summary
| Measurement | South African | Immigrants from Trinidad and Tobago |
| Minimum | $22,500 | $23,659 |
| Maximum | $100,655 | $124,816 |
| Range | $78,155 | $101,157 |
| Mean | $71,429 | $59,659 |
| Median | $73,431 | $57,844 |
| Interquartile 25% (IQ1) | $61,016 | $50,192 |
| Interquartile 75% (IQ3) | $84,692 | $65,956 |
| Interquartile Range (IQR) | $23,677 | $15,764 |
| Standard Deviation (Sample) | $18,184 | $17,128 |
| Standard Deviation (Population) | $17,784 | $17,048 |
Similar Demographics by Householder Income Over 65 years
Demographics Similar to South Africans by Householder Income Over 65 years
In terms of householder income over 65 years, the demographic groups most similar to South Africans are Immigrants from England ($65,715, a difference of 0.10%), Immigrants from Malaysia ($65,497, a difference of 0.24%), Zimbabwean ($65,854, a difference of 0.31%), Egyptian ($65,441, a difference of 0.32%), and Marshallese ($65,874, a difference of 0.34%).
| Demographics | Rating | Rank | Householder Income Over 65 years |
| Immigrants | Norway | 99.5 /100 | #59 | Exceptional $66,118 |
| Immigrants | Lithuania | 99.5 /100 | #60 | Exceptional $66,087 |
| Maltese | 99.5 /100 | #61 | Exceptional $66,027 |
| Immigrants | Sierra Leone | 99.5 /100 | #62 | Exceptional $66,009 |
| Marshallese | 99.4 /100 | #63 | Exceptional $65,874 |
| Zimbabweans | 99.4 /100 | #64 | Exceptional $65,854 |
| Immigrants | England | 99.3 /100 | #65 | Exceptional $65,715 |
| South Africans | 99.3 /100 | #66 | Exceptional $65,652 |
| Immigrants | Malaysia | 99.1 /100 | #67 | Exceptional $65,497 |
| Egyptians | 99.1 /100 | #68 | Exceptional $65,441 |
| Samoans | 99.1 /100 | #69 | Exceptional $65,427 |
| Mongolians | 99.0 /100 | #70 | Exceptional $65,326 |
| Greeks | 98.9 /100 | #71 | Exceptional $65,306 |
| Argentineans | 98.9 /100 | #72 | Exceptional $65,246 |
| Immigrants | Ethiopia | 98.9 /100 | #73 | Exceptional $65,238 |
Demographics Similar to Immigrants from Trinidad and Tobago by Householder Income Over 65 years
In terms of householder income over 65 years, the demographic groups most similar to Immigrants from Trinidad and Tobago are American ($55,527, a difference of 0.13%), Osage ($55,677, a difference of 0.14%), Immigrants from Bangladesh ($55,394, a difference of 0.37%), German Russian ($55,356, a difference of 0.44%), and Trinidadian and Tobagonian ($55,327, a difference of 0.49%).
| Demographics | Rating | Rank | Householder Income Over 65 years |
| Central Americans | 0.8 /100 | #246 | Tragic $56,321 |
| Yakama | 0.7 /100 | #247 | Tragic $56,234 |
| Vietnamese | 0.6 /100 | #248 | Tragic $56,143 |
| Mexican American Indians | 0.6 /100 | #249 | Tragic $56,089 |
| Immigrants | Bosnia and Herzegovina | 0.5 /100 | #250 | Tragic $55,986 |
| Immigrants | Portugal | 0.5 /100 | #251 | Tragic $55,924 |
| Osage | 0.4 /100 | #252 | Tragic $55,677 |
| Immigrants | Trinidad and Tobago | 0.4 /100 | #253 | Tragic $55,598 |
| Americans | 0.3 /100 | #254 | Tragic $55,527 |
| Immigrants | Bangladesh | 0.3 /100 | #255 | Tragic $55,394 |
| German Russians | 0.3 /100 | #256 | Tragic $55,356 |
| Trinidadians and Tobagonians | 0.3 /100 | #257 | Tragic $55,327 |
| Ecuadorians | 0.2 /100 | #258 | Tragic $54,958 |
| West Indians | 0.2 /100 | #259 | Tragic $54,936 |
| Immigrants | West Indies | 0.2 /100 | #260 | Tragic $54,927 |