South African vs Immigrants from Lebanon Single Father Poverty
COMPARE
South African
Immigrants from Lebanon
Single Father Poverty
Single Father Poverty Comparison
South Africans
Immigrants from Lebanon
16.1%
SINGLE FATHER POVERTY
75.1/ 100
METRIC RATING
149th/ 347
METRIC RANK
17.9%
SINGLE FATHER POVERTY
0.0/ 100
METRIC RATING
285th/ 347
METRIC RANK
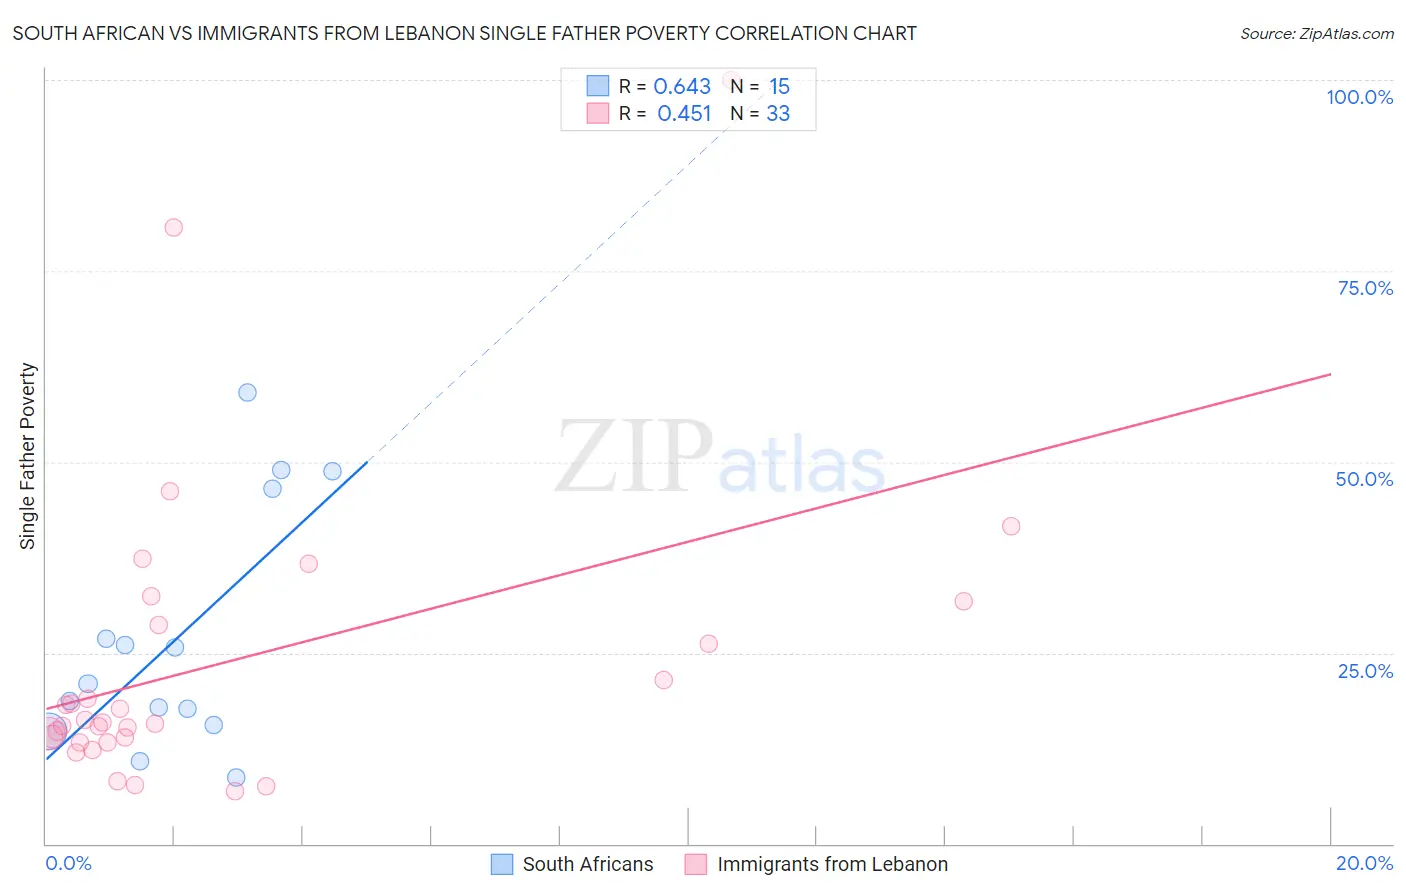
South African vs Immigrants from Lebanon Single Father Poverty Correlation Chart
The statistical analysis conducted on geographies consisting of 151,650,915 people shows a significant positive correlation between the proportion of South Africans and poverty level among single fathers in the United States with a correlation coefficient (R) of 0.643 and weighted average of 16.1%. Similarly, the statistical analysis conducted on geographies consisting of 180,091,576 people shows a moderate positive correlation between the proportion of Immigrants from Lebanon and poverty level among single fathers in the United States with a correlation coefficient (R) of 0.451 and weighted average of 17.9%, a difference of 11.1%.
Single Father Poverty Correlation Summary
| Measurement | South African | Immigrants from Lebanon |
| Minimum | 8.7% | 6.9% |
| Maximum | 59.2% | 100.0% |
| Range | 50.5% | 93.1% |
| Mean | 27.1% | 23.9% |
| Median | 20.9% | 15.8% |
| Interquartile 25% (IQ1) | 15.6% | 13.6% |
| Interquartile 75% (IQ3) | 46.4% | 30.1% |
| Interquartile Range (IQR) | 30.8% | 16.5% |
| Standard Deviation (Sample) | 15.9% | 20.0% |
| Standard Deviation (Population) | 15.3% | 19.7% |
Similar Demographics by Single Father Poverty
Demographics Similar to South Africans by Single Father Poverty
In terms of single father poverty, the demographic groups most similar to South Africans are Jordanian (16.1%, a difference of 0.060%), Nigerian (16.1%, a difference of 0.10%), Colombian (16.1%, a difference of 0.12%), Immigrants from France (16.1%, a difference of 0.12%), and Immigrants from Zimbabwe (16.1%, a difference of 0.18%).
| Demographics | Rating | Rank | Single Father Poverty |
| Immigrants | Mexico | 83.3 /100 | #142 | Excellent 16.0% |
| Immigrants | Central America | 83.1 /100 | #143 | Excellent 16.0% |
| Immigrants | Kuwait | 81.4 /100 | #144 | Excellent 16.0% |
| Immigrants | Western Asia | 80.7 /100 | #145 | Excellent 16.0% |
| Immigrants | Hungary | 78.3 /100 | #146 | Good 16.1% |
| Colombians | 77.1 /100 | #147 | Good 16.1% |
| Nigerians | 76.8 /100 | #148 | Good 16.1% |
| South Africans | 75.1 /100 | #149 | Good 16.1% |
| Jordanians | 74.2 /100 | #150 | Good 16.1% |
| Immigrants | France | 73.1 /100 | #151 | Good 16.1% |
| Immigrants | Zimbabwe | 72.1 /100 | #152 | Good 16.1% |
| Immigrants | Israel | 72.0 /100 | #153 | Good 16.1% |
| Mexicans | 70.1 /100 | #154 | Good 16.1% |
| Immigrants | Nicaragua | 67.8 /100 | #155 | Good 16.2% |
| Immigrants | Jordan | 66.0 /100 | #156 | Good 16.2% |
Demographics Similar to Immigrants from Lebanon by Single Father Poverty
In terms of single father poverty, the demographic groups most similar to Immigrants from Lebanon are Immigrants from North Macedonia (17.9%, a difference of 0.18%), Welsh (17.8%, a difference of 0.37%), Alsatian (17.8%, a difference of 0.38%), Carpatho Rusyn (18.0%, a difference of 0.40%), and Bahamian (18.0%, a difference of 0.42%).
| Demographics | Rating | Rank | Single Father Poverty |
| Germans | 0.0 /100 | #278 | Tragic 17.7% |
| Iroquois | 0.0 /100 | #279 | Tragic 17.7% |
| Scottish | 0.0 /100 | #280 | Tragic 17.7% |
| English | 0.0 /100 | #281 | Tragic 17.8% |
| Dutch | 0.0 /100 | #282 | Tragic 17.8% |
| Alsatians | 0.0 /100 | #283 | Tragic 17.8% |
| Welsh | 0.0 /100 | #284 | Tragic 17.8% |
| Immigrants | Lebanon | 0.0 /100 | #285 | Tragic 17.9% |
| Immigrants | North Macedonia | 0.0 /100 | #286 | Tragic 17.9% |
| Carpatho Rusyns | 0.0 /100 | #287 | Tragic 18.0% |
| Bahamians | 0.0 /100 | #288 | Tragic 18.0% |
| Irish | 0.0 /100 | #289 | Tragic 18.0% |
| West Indians | 0.0 /100 | #290 | Tragic 18.0% |
| Alaskan Athabascans | 0.0 /100 | #291 | Tragic 18.1% |
| Immigrants | Bahamas | 0.0 /100 | #292 | Tragic 18.1% |