German Russian vs Immigrants from Lebanon Cognitive Disability
COMPARE
German Russian
Immigrants from Lebanon
Cognitive Disability
Cognitive Disability Comparison
German Russians
Immigrants from Lebanon
18.2%
COGNITIVE DISABILITY
0.0/ 100
METRIC RATING
295th/ 347
METRIC RANK
16.8%
COGNITIVE DISABILITY
98.4/ 100
METRIC RATING
98th/ 347
METRIC RANK
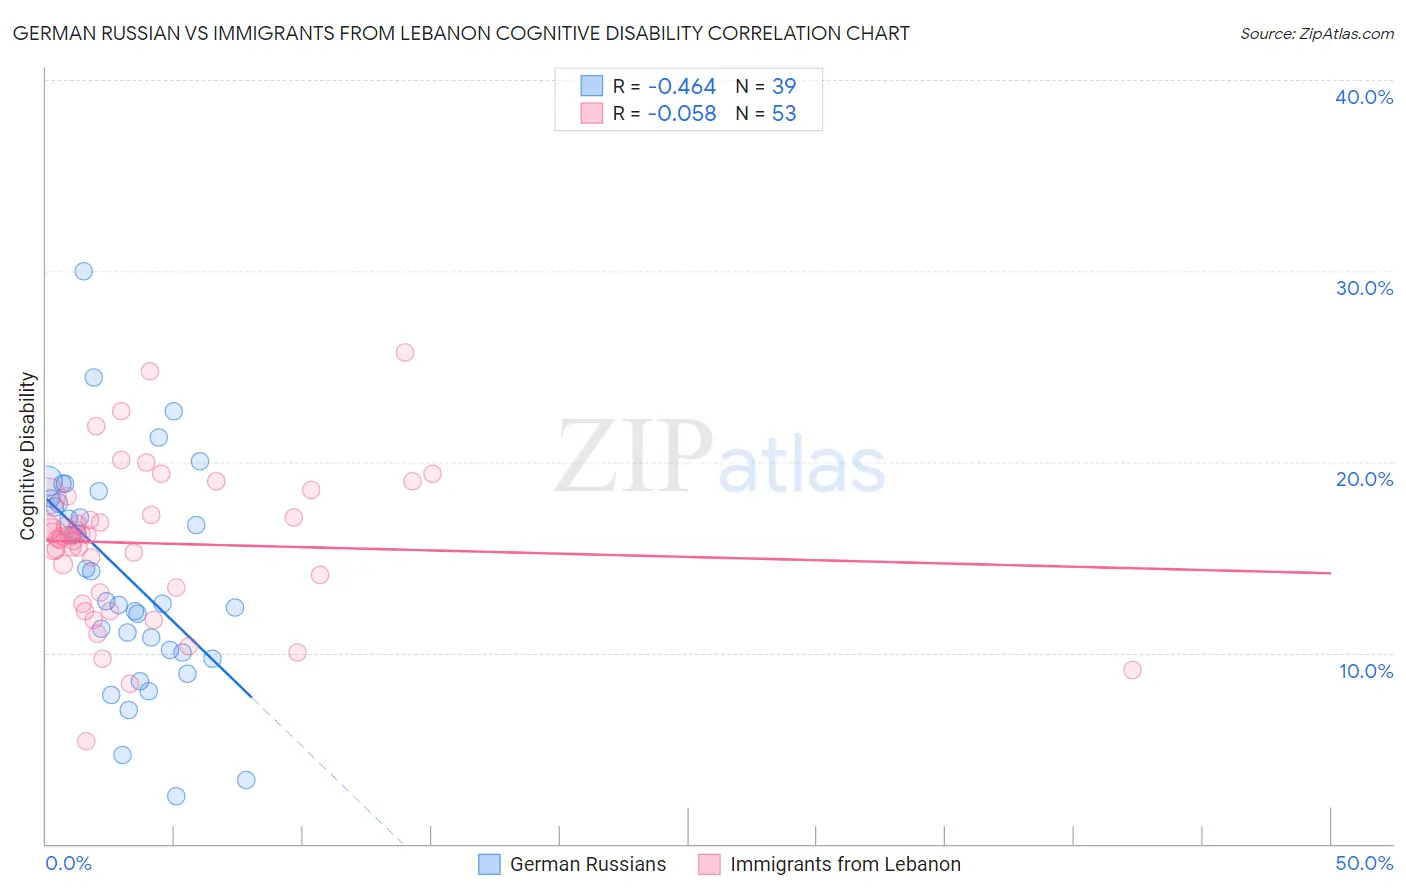
German Russian vs Immigrants from Lebanon Cognitive Disability Correlation Chart
The statistical analysis conducted on geographies consisting of 96,458,648 people shows a moderate negative correlation between the proportion of German Russians and percentage of population with cognitive disability in the United States with a correlation coefficient (R) of -0.464 and weighted average of 18.2%. Similarly, the statistical analysis conducted on geographies consisting of 217,153,550 people shows a slight negative correlation between the proportion of Immigrants from Lebanon and percentage of population with cognitive disability in the United States with a correlation coefficient (R) of -0.058 and weighted average of 16.8%, a difference of 8.7%.
Cognitive Disability Correlation Summary
| Measurement | German Russian | Immigrants from Lebanon |
| Minimum | 2.5% | 5.4% |
| Maximum | 30.0% | 25.7% |
| Range | 27.6% | 20.3% |
| Mean | 14.0% | 15.7% |
| Median | 12.7% | 16.1% |
| Interquartile 25% (IQ1) | 10.0% | 13.3% |
| Interquartile 75% (IQ3) | 18.1% | 17.7% |
| Interquartile Range (IQR) | 8.0% | 4.4% |
| Standard Deviation (Sample) | 5.9% | 3.9% |
| Standard Deviation (Population) | 5.8% | 3.9% |
Similar Demographics by Cognitive Disability
Demographics Similar to German Russians by Cognitive Disability
In terms of cognitive disability, the demographic groups most similar to German Russians are Immigrants from Burma/Myanmar (18.2%, a difference of 0.020%), British West Indian (18.2%, a difference of 0.17%), Blackfeet (18.3%, a difference of 0.17%), Japanese (18.3%, a difference of 0.17%), and Ghanaian (18.3%, a difference of 0.20%).
| Demographics | Rating | Rank | Cognitive Disability |
| Immigrants | West Indies | 0.1 /100 | #288 | Tragic 18.1% |
| Natives/Alaskans | 0.1 /100 | #289 | Tragic 18.1% |
| Immigrants | Africa | 0.1 /100 | #290 | Tragic 18.1% |
| Ottawa | 0.1 /100 | #291 | Tragic 18.2% |
| Iroquois | 0.1 /100 | #292 | Tragic 18.2% |
| Central American Indians | 0.1 /100 | #293 | Tragic 18.2% |
| British West Indians | 0.1 /100 | #294 | Tragic 18.2% |
| German Russians | 0.0 /100 | #295 | Tragic 18.2% |
| Immigrants | Burma/Myanmar | 0.0 /100 | #296 | Tragic 18.2% |
| Blackfeet | 0.0 /100 | #297 | Tragic 18.3% |
| Japanese | 0.0 /100 | #298 | Tragic 18.3% |
| Ghanaians | 0.0 /100 | #299 | Tragic 18.3% |
| Creek | 0.0 /100 | #300 | Tragic 18.3% |
| Immigrants | Ghana | 0.0 /100 | #301 | Tragic 18.3% |
| Barbadians | 0.0 /100 | #302 | Tragic 18.3% |
Demographics Similar to Immigrants from Lebanon by Cognitive Disability
In terms of cognitive disability, the demographic groups most similar to Immigrants from Lebanon are Dutch (16.8%, a difference of 0.020%), Finnish (16.8%, a difference of 0.040%), English (16.8%, a difference of 0.060%), Jordanian (16.8%, a difference of 0.090%), and Asian (16.7%, a difference of 0.12%).
| Demographics | Rating | Rank | Cognitive Disability |
| Danes | 98.8 /100 | #91 | Exceptional 16.7% |
| Immigrants | South America | 98.8 /100 | #92 | Exceptional 16.7% |
| Immigrants | Southern Europe | 98.7 /100 | #93 | Exceptional 16.7% |
| Asians | 98.7 /100 | #94 | Exceptional 16.7% |
| English | 98.6 /100 | #95 | Exceptional 16.8% |
| Finns | 98.5 /100 | #96 | Exceptional 16.8% |
| Dutch | 98.5 /100 | #97 | Exceptional 16.8% |
| Immigrants | Lebanon | 98.4 /100 | #98 | Exceptional 16.8% |
| Jordanians | 98.2 /100 | #99 | Exceptional 16.8% |
| Immigrants | Russia | 98.2 /100 | #100 | Exceptional 16.8% |
| Immigrants | Asia | 98.1 /100 | #101 | Exceptional 16.8% |
| Irish | 98.1 /100 | #102 | Exceptional 16.8% |
| Paraguayans | 98.0 /100 | #103 | Exceptional 16.8% |
| Palestinians | 98.0 /100 | #104 | Exceptional 16.8% |
| Immigrants | Eastern Asia | 97.9 /100 | #105 | Exceptional 16.8% |