South African vs Immigrants from Hong Kong 11th Grade
COMPARE
South African
Immigrants from Hong Kong
11th Grade
11th Grade Comparison
South Africans
Immigrants from Hong Kong
93.6%
11TH GRADE
99.2/ 100
METRIC RATING
91st/ 347
METRIC RANK
92.2%
11TH GRADE
23.3/ 100
METRIC RATING
204th/ 347
METRIC RANK
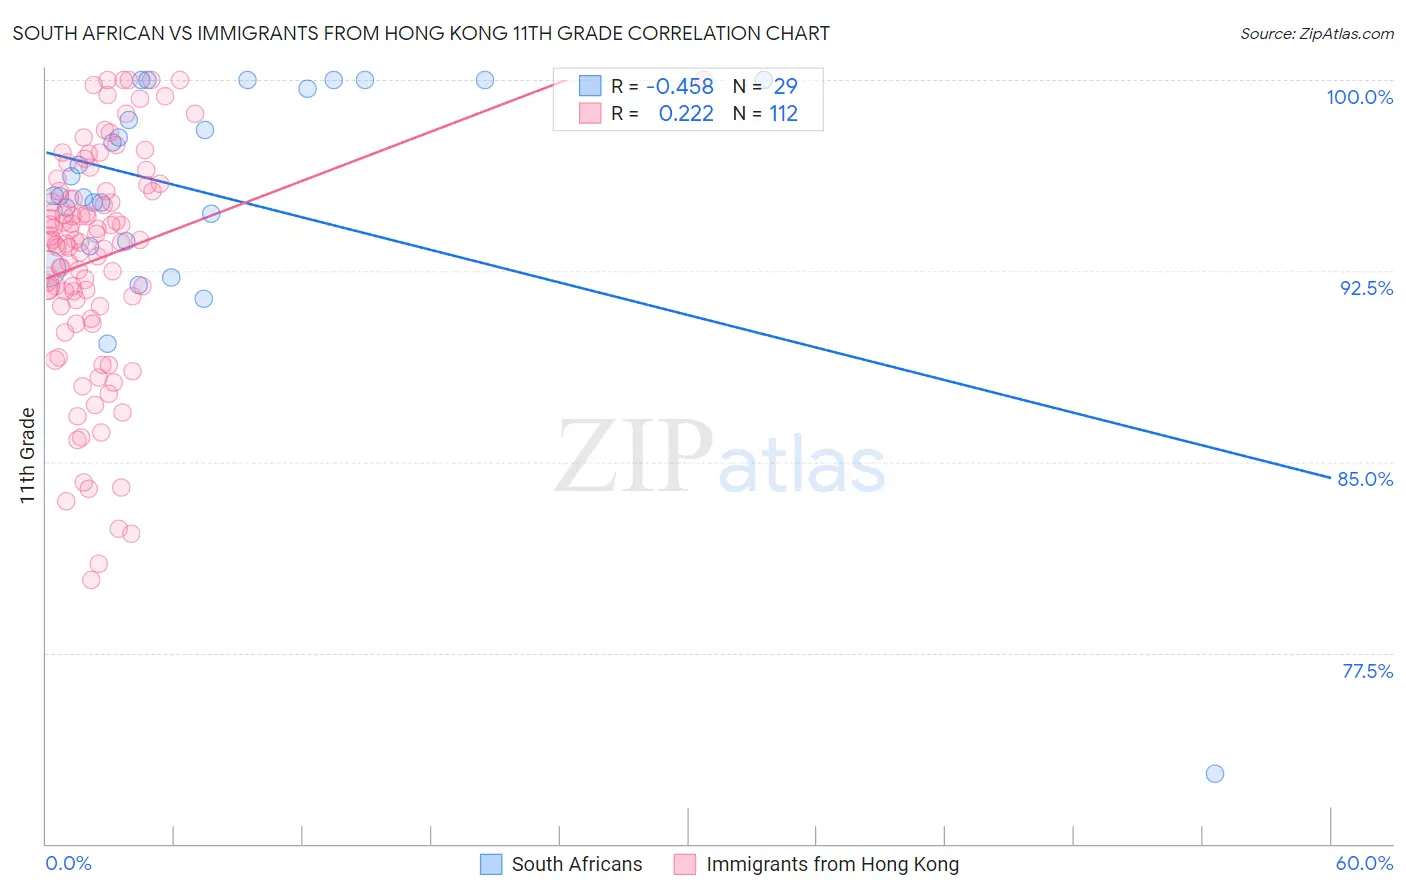
South African vs Immigrants from Hong Kong 11th Grade Correlation Chart
The statistical analysis conducted on geographies consisting of 182,604,532 people shows a moderate negative correlation between the proportion of South Africans and percentage of population with at least 11th grade education in the United States with a correlation coefficient (R) of -0.458 and weighted average of 93.6%. Similarly, the statistical analysis conducted on geographies consisting of 253,990,250 people shows a weak positive correlation between the proportion of Immigrants from Hong Kong and percentage of population with at least 11th grade education in the United States with a correlation coefficient (R) of 0.222 and weighted average of 92.2%, a difference of 1.5%.
11th Grade Correlation Summary
| Measurement | South African | Immigrants from Hong Kong |
| Minimum | 72.7% | 80.4% |
| Maximum | 100.0% | 100.0% |
| Range | 27.3% | 19.6% |
| Mean | 95.5% | 93.0% |
| Median | 95.4% | 93.7% |
| Interquartile 25% (IQ1) | 93.6% | 91.1% |
| Interquartile 75% (IQ3) | 99.8% | 95.6% |
| Interquartile Range (IQR) | 6.3% | 4.5% |
| Standard Deviation (Sample) | 5.3% | 4.5% |
| Standard Deviation (Population) | 5.2% | 4.4% |
Similar Demographics by 11th Grade
Demographics Similar to South Africans by 11th Grade
In terms of 11th grade, the demographic groups most similar to South Africans are Ottawa (93.6%, a difference of 0.010%), Immigrants from Bulgaria (93.6%, a difference of 0.010%), Immigrants from South Central Asia (93.6%, a difference of 0.020%), Immigrants from Western Europe (93.6%, a difference of 0.020%), and Cambodian (93.6%, a difference of 0.020%).
| Demographics | Rating | Rank | 11th Grade |
| Immigrants | Taiwan | 99.3 /100 | #84 | Exceptional 93.6% |
| Immigrants | Switzerland | 99.3 /100 | #85 | Exceptional 93.6% |
| Immigrants | South Central Asia | 99.2 /100 | #86 | Exceptional 93.6% |
| Immigrants | Western Europe | 99.2 /100 | #87 | Exceptional 93.6% |
| Cambodians | 99.2 /100 | #88 | Exceptional 93.6% |
| Burmese | 99.2 /100 | #89 | Exceptional 93.6% |
| Ottawa | 99.2 /100 | #90 | Exceptional 93.6% |
| South Africans | 99.2 /100 | #91 | Exceptional 93.6% |
| Immigrants | Bulgaria | 99.1 /100 | #92 | Exceptional 93.6% |
| Puget Sound Salish | 99.1 /100 | #93 | Exceptional 93.6% |
| Swiss | 99.0 /100 | #94 | Exceptional 93.6% |
| Immigrants | France | 99.0 /100 | #95 | Exceptional 93.6% |
| Immigrants | Turkey | 98.9 /100 | #96 | Exceptional 93.5% |
| Immigrants | Iran | 98.9 /100 | #97 | Exceptional 93.5% |
| Immigrants | Israel | 98.8 /100 | #98 | Exceptional 93.5% |
Demographics Similar to Immigrants from Hong Kong by 11th Grade
In terms of 11th grade, the demographic groups most similar to Immigrants from Hong Kong are Immigrants from Sudan (92.3%, a difference of 0.0%), Kiowa (92.2%, a difference of 0.0%), Bolivian (92.2%, a difference of 0.0%), Immigrants from Eastern Africa (92.3%, a difference of 0.010%), and Immigrants from Oceania (92.2%, a difference of 0.010%).
| Demographics | Rating | Rank | 11th Grade |
| Marshallese | 26.0 /100 | #197 | Fair 92.3% |
| Hawaiians | 25.5 /100 | #198 | Fair 92.3% |
| Immigrants | Uganda | 25.2 /100 | #199 | Fair 92.3% |
| Samoans | 25.1 /100 | #200 | Fair 92.3% |
| Immigrants | China | 25.1 /100 | #201 | Fair 92.3% |
| Immigrants | Eastern Africa | 24.1 /100 | #202 | Fair 92.3% |
| Immigrants | Sudan | 23.5 /100 | #203 | Fair 92.3% |
| Immigrants | Hong Kong | 23.3 /100 | #204 | Fair 92.2% |
| Kiowa | 23.2 /100 | #205 | Fair 92.2% |
| Bolivians | 23.2 /100 | #206 | Fair 92.2% |
| Immigrants | Oceania | 22.4 /100 | #207 | Fair 92.2% |
| Colville | 21.8 /100 | #208 | Fair 92.2% |
| Tongans | 19.8 /100 | #209 | Poor 92.2% |
| Ethiopians | 18.8 /100 | #210 | Poor 92.2% |
| Immigrants | Micronesia | 17.7 /100 | #211 | Poor 92.2% |