South African vs Immigrants from Venezuela Ambulatory Disability
COMPARE
South African
Immigrants from Venezuela
Ambulatory Disability
Ambulatory Disability Comparison
South Africans
Immigrants from Venezuela
5.9%
AMBULATORY DISABILITY
96.3/ 100
METRIC RATING
112th/ 347
METRIC RANK
5.4%
AMBULATORY DISABILITY
100.0/ 100
METRIC RATING
31st/ 347
METRIC RANK
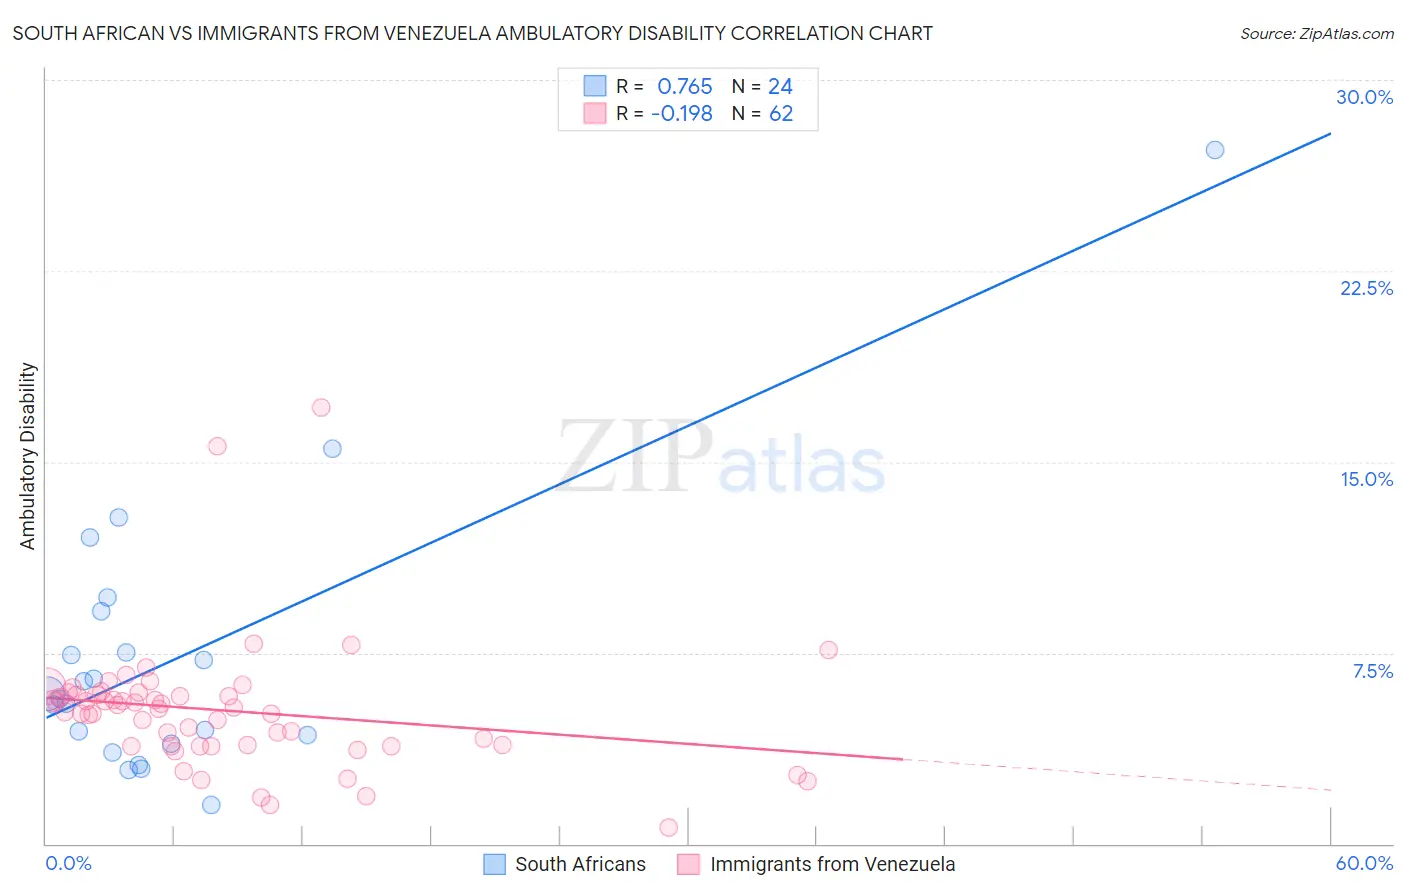
South African vs Immigrants from Venezuela Ambulatory Disability Correlation Chart
The statistical analysis conducted on geographies consisting of 182,561,768 people shows a strong positive correlation between the proportion of South Africans and percentage of population with ambulatory disability in the United States with a correlation coefficient (R) of 0.765 and weighted average of 5.9%. Similarly, the statistical analysis conducted on geographies consisting of 287,823,079 people shows a poor negative correlation between the proportion of Immigrants from Venezuela and percentage of population with ambulatory disability in the United States with a correlation coefficient (R) of -0.198 and weighted average of 5.4%, a difference of 7.5%.
Ambulatory Disability Correlation Summary
| Measurement | South African | Immigrants from Venezuela |
| Minimum | 1.5% | 0.63% |
| Maximum | 27.3% | 17.1% |
| Range | 25.7% | 16.5% |
| Mean | 7.3% | 5.2% |
| Median | 5.8% | 5.3% |
| Interquartile 25% (IQ1) | 4.1% | 3.8% |
| Interquartile 75% (IQ3) | 8.3% | 5.8% |
| Interquartile Range (IQR) | 4.2% | 2.0% |
| Standard Deviation (Sample) | 5.4% | 2.6% |
| Standard Deviation (Population) | 5.3% | 2.5% |
Similar Demographics by Ambulatory Disability
Demographics Similar to South Africans by Ambulatory Disability
In terms of ambulatory disability, the demographic groups most similar to South Africans are Danish (5.8%, a difference of 0.13%), Immigrants from Colombia (5.8%, a difference of 0.20%), Immigrants from Uruguay (5.9%, a difference of 0.22%), Immigrants from Poland (5.9%, a difference of 0.28%), and Immigrants from Netherlands (5.8%, a difference of 0.38%).
| Demographics | Rating | Rank | Ambulatory Disability |
| Immigrants | Czechoslovakia | 97.4 /100 | #105 | Exceptional 5.8% |
| Immigrants | Morocco | 97.3 /100 | #106 | Exceptional 5.8% |
| Uruguayans | 97.2 /100 | #107 | Exceptional 5.8% |
| Colombians | 97.2 /100 | #108 | Exceptional 5.8% |
| Immigrants | Netherlands | 97.1 /100 | #109 | Exceptional 5.8% |
| Immigrants | Colombia | 96.7 /100 | #110 | Exceptional 5.8% |
| Danes | 96.6 /100 | #111 | Exceptional 5.8% |
| South Africans | 96.3 /100 | #112 | Exceptional 5.9% |
| Immigrants | Uruguay | 95.6 /100 | #113 | Exceptional 5.9% |
| Immigrants | Poland | 95.4 /100 | #114 | Exceptional 5.9% |
| South American Indians | 94.8 /100 | #115 | Exceptional 5.9% |
| Immigrants | Africa | 94.7 /100 | #116 | Exceptional 5.9% |
| Immigrants | South Eastern Asia | 93.6 /100 | #117 | Exceptional 5.9% |
| Russians | 93.4 /100 | #118 | Exceptional 5.9% |
| Norwegians | 93.1 /100 | #119 | Exceptional 5.9% |
Demographics Similar to Immigrants from Venezuela by Ambulatory Disability
In terms of ambulatory disability, the demographic groups most similar to Immigrants from Venezuela are Immigrants from Turkey (5.4%, a difference of 0.020%), Immigrants from Australia (5.5%, a difference of 0.17%), Immigrants from Pakistan (5.5%, a difference of 0.29%), Immigrants from Asia (5.5%, a difference of 0.44%), and Afghan (5.5%, a difference of 0.49%).
| Demographics | Rating | Rank | Ambulatory Disability |
| Immigrants | Saudi Arabia | 100.0 /100 | #24 | Exceptional 5.4% |
| Zimbabweans | 100.0 /100 | #25 | Exceptional 5.4% |
| Immigrants | Nepal | 100.0 /100 | #26 | Exceptional 5.4% |
| Asians | 100.0 /100 | #27 | Exceptional 5.4% |
| Cambodians | 100.0 /100 | #28 | Exceptional 5.4% |
| Immigrants | Iran | 100.0 /100 | #29 | Exceptional 5.4% |
| Immigrants | Turkey | 100.0 /100 | #30 | Exceptional 5.4% |
| Immigrants | Venezuela | 100.0 /100 | #31 | Exceptional 5.4% |
| Immigrants | Australia | 100.0 /100 | #32 | Exceptional 5.5% |
| Immigrants | Pakistan | 100.0 /100 | #33 | Exceptional 5.5% |
| Immigrants | Asia | 100.0 /100 | #34 | Exceptional 5.5% |
| Afghans | 100.0 /100 | #35 | Exceptional 5.5% |
| Immigrants | Malaysia | 100.0 /100 | #36 | Exceptional 5.5% |
| Turks | 100.0 /100 | #37 | Exceptional 5.5% |
| Cypriots | 100.0 /100 | #38 | Exceptional 5.5% |